Download
1 / 9
90 likes | 94 Views
MATLAB is widely used technical computing software. MATLAB provides graphical design tools such as Simulink and Dials. This paper deals in designing modulation and demodulation techniques of various analog and digital communication systems like AM, FM, PM, PAM, PWM, PPM, PCM, ASK, FSK, PSK, MSK, QPSK, BPSK, BFSK, DSB SC, SSB SC. A graphical user interface provides a familiar environment to work. This environment contains pushbuttons, toggle buttons, lists, menus, text boxes, and so forth, all of which are already familiar to the user, so that he or she can concentrate on using the application rather than on the mechanics involved in doing things. Many MATLAB products, such as Curve Fitting Toolbox, Signal Processing Toolbox and Control System Toolbox include apps with custom user interfaces. However, GUIs are harder for the programmer because a GUI based program must be prepared for mouse clicks or possibly keyboard input for any GUI element at any time. Such inputs are known as events, and a program that responds to events is said to be event driven. A graphical User interface GUI is a system of graphical elements that allow a user to interact with software using mouse application. GUI can also display data in tabular form or as plots, and can group related components. The graphical user interface GUI , is a type of user interface that allows users to interact with electronic devices through graphical icons and visual indicators such as secondary notation, instead of text based user interfaces, typed command labels or text navigation. Mohit Sharma | Subham Sharma | Gaurav Sahu "Designing MATLAB GUI for various Analog and Digital Communication Systems" Published in International Journal of Trend in Scientific Research and Development (ijtsrd), ISSN: 2456-6470, Volume-2 | Issue-1 , December 2017, URL: https://www.ijtsrd.com/papers/ijtsrd8269.pdf Paper URL: http://www.ijtsrd.com/engineering/electronics-and-communication-engineering/8269/designing-matlab-gui-for-various-analog-and--digital-communication-systems/mohit-sharma<br>

E N D
International Research Research and Development (IJTSRD) International Open Access Journal International Open Access Journal International Journal of Trend in Scientific Scientific (IJTSRD) ISSN No: 2456 - 6470 | www.ijtsrd.com | Volume Designing MATLAB GUI for various Analog and Designing MATLAB GUI for various Analog and ISSN No: 2456 | www.ijtsrd.com | Volume - 2 | Issue – 1 Designing MATLAB GUI for various Analog and Digital Communication Systems Digital Communication Systems Mohit Sharma Student, BK Birla Institute of Engineering and Technology, Pilani Subham Sharma Student, BK Birla Institute of Engineering and Technology, Pilani Gaurav Sahu Gaurav Sahu Assistant Professor, BK Birla Institute of Engineering and Assistant Professor, BK Birla Institute of Engineering and Technology, Pilani Technology, Pilani ABSTRACT MATLAB is widely used technical computing software. MATLAB provides graphical design tools such as Simulink and Dials. This paper deals in designing modulation and demodulation techniques of various analog and digital communication systems like AM, FM, PM, PAM, PWM, PPM, PCM, ASK, FSK, PSK, MSK, QPSK, BPSK, BFSK, DSB- A graphical user interface provides a familiar environment to work. This environment contains pushbuttons, toggle buttons, lists, menus, te and so forth, all of which are already familiar to the user, so that he or she can concentrate on using the application rather than on the mechanics involved in doing things. Many MATLAB products, such as Curve Fitting Toolbox, Signal Processing Control System Toolbox include apps with custom user interfaces. However, GUIs are harder for the programmer because a GUI-based program must be prepared for mouse clicks (or possibly keyboard input) for any GUI element at any time. Such inputs known as events, and a program that responds to events is said to be event driven. A graphical User interface (GUI) is a system of graphical elements that allow a user to interact with software using mouse application. GUI can also display data in tabular form or as plots, and can group related components. The graphical user interface (GUI), is a type of user interface that allows users to interact with electronic devices through graphical icons and visual indicators such as secondary notation, instead of text-based user interfaces, typed command labels or text navigation. MATLAB is widely used technical computing software. MATLAB provides graphical design tools such as Simulink and Dials. This paper deals in designing modulation and demodulation techniques of tal communication systems like AM, FM, PM, PAM, PWM, PPM, PCM, ASK, FSK, Keywords: Demodulation Processes, Graphs 1. Introduction MATLAB-GUI, GUI, Modulation Modulation and and Demodulation Processes, Graphs A graphical user interface (GUI) is a graphical display in one or more windows containing controls, called components that enable a user to perform interactive tasks [1]. The GUI user does not have to create a script or type commands at the command line to accomplish the tasks. Unlike coding programs to accomplish tasks, nderstand the details of how the tasks are performed. GUI components include menus, toolbars, push buttons, radio buttons, list boxes, and sliders, etc. GUI is created using MATLAB tools, it can also perform any type of computation, read and write es, communicate with other GUIs, and display A graphical user interface (GUI) is a graphical display in one or more windows containing components that enable a user to perform interactive tasks [1]. The GUI user does not have to create a script or type commands at the command line to accomplish the tasks. Unlike coding programs to accomplish tasks, the GUI user need not understand the details of how the tasks are performed. GUI components include menus, toolbars, push buttons, radio buttons, list boxes, and sliders, etc. GUI is created using MATLAB tools, it can also perform any type of computation, read and write data files, communicate with other GUIs, and display data as tables or as plots [1, 2]. data as tables or as plots [1, 2]. -SC, SSB-SC. A graphical user interface provides a familiar environment to work. This environment contains pushbuttons, toggle buttons, lists, menus, text boxes, and so forth, all of which are already familiar to the user, so that he or she can concentrate on using the application rather than on the mechanics involved in doing things. Many MATLAB products, such as Curve Fitting Toolbox, Signal Processing Toolbox and Control System Toolbox include apps with custom user interfaces. However, GUIs are harder for the based program must be prepared for mouse clicks (or possibly keyboard input) for any GUI element at any time. Such inputs are known as events, and a program that responds to events is said to be event driven. A graphical User interface (GUI) is a system of graphical elements that allow a user to interact with software using mouse application. 2.Classification of Communication System Classification of Communication System Communication is the basic process of exchanging information. The basic components of electronics and Communication is the basic process of exchanging information. The basic components of electronics and communication system are: 1.Transmitter: It is a collection of electronic circuits designed to convert the information into a signal suitable for transmission communication medium [8]. 2.Channel: It is the medium by which the electronic signal is transmitter from one place [8]. It is a collection of electronic circuits designed to convert the information into a signal suitable for transmission communication medium [8]. It is the medium by which the electronic signal is transmitter from one place to another place ular form or as plots, and can group related components. The graphical user interface (GUI), is a type of user interface that allows users to interact with electronic devices through graphical icons and visual indicators such as secondary based user interfaces, typed over over a a giver giver @ IJTSRD | Available Online @ www.ijtsrd.com @ IJTSRD | Available Online @ www.ijtsrd.com | Volume – 2 | Issue – 1 | Nov-Dec 2017 Dec 2017 Page: 1397
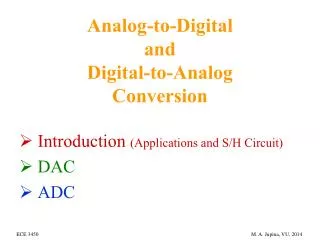
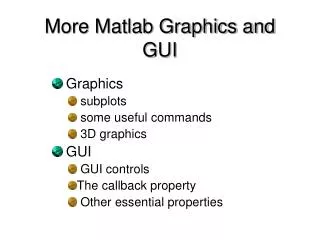
International Journal of Trend in Scientific Research and Development (IJTSRD) ISSN: 2456-6470 3.Receiver: It is a collection of electronic circuits designed to convert the signal back to the original information [8]. applying modulation process with a high frequency carrier wave, which doesn’t affect the parameters of the modulating signal [7] and results into a modulated wave. 3.Modulation & Demodulation Processes 5.Advantages of Modulation Modulation: characteristic (e.g. amplitude, frequency or phase) of a carrier wave in accordance with the intensity of the signal is known as modulation. The resultant wave is called as modulated wave. The process of changing some The advantages of modulation are as follows: Reduction of antenna size No signal mixing Increased communication range Possibility of bandwidth adjustment Demodulation: The process of recovering the original signal from the modulated wave is known as demodulation or detection. 6.Types of Modulation There demodulation techniques used, they are classified as [7]: are various processes. types of modulation and the Depending upon 4.Need of Modulation Baseband signals are incompatible for direct/long transmission. For such signals to make them travel longer distance, its strength has to be increased by Figure 1: Types of Modulation data visualization, image processing, and presentation graphics. However, designing GUI is a difficult task for the programmer because a GUI-based program must be 7.System Designing A graphical user interface provides user a familiar environment to work [4]. This environment contains pushbuttons, toggle buttons, lists, menus, text boxes, and so forth, all of which are already familiar to the user, so that the user can concentrate on using the application rather than on the mechanics involved in doing things [4]. MATLAB includes high-level commands for two-dimensional and three-dimensional prepared for mouse clicks (or possibly keyboard input) for any GUI element at any time [4]. Figure 2 shows various buttons of GUI. @ IJTSRD | Available Online @ www.ijtsrd.com | Volume – 2 | Issue – 1 | Nov-Dec 2017 Page: 1398
International Journal of Trend in Scientific Research and Development (IJTSRD) ISSN: 2456-6470 Figure 2: Layout of MATLAB GUI The main elements required to create MATLAB Graphical User Interface are as follows and is shown in Figure 3. elements that perform a dual function: display data and interaction. For example, a plotted line can both display data and can alter data when a user click on the line drag it on a new position. Use mouse downs, drags, and mouse ups anywhere within the figure to perform an action. (a)Components- Each item on a MATLAB GUI (pushbuttons, labels, edit boxes, etc.) is a graphical component. The types of components include graphical controls (pushbuttons, edit boxes, lists, sliders, etc.), static elements(frames and text strings), menus, and axes. Graphical controls and static elements are created by the function control, and menus are created by the functions menu and context menu. Axes, which are used to display graphical data, are created by the function axes [4]. (c)Callbacks -Finally, there must be some way to perform an action if a user clicks a mouse on a button or types information on a keyboard. A mouse click or a key press is an event, and the MATLAB program must respond to each event if the program is to perform its function. For example, if a user clicks on a button, that event must cause the MATLAB code that implements the function of the button to be executed. The code executed in response to an event is known as a call back. There must be a callback to implement the function of each graphical component on the GUI [4]. (b)Figures-The components of a GUI must be arranged within a figure, which is a window on the computer screen. Empty figures can be created with the function figure and can be used to hold any combination of components [4]. Use graphical Figure 3: Layout with Components, Figure and Callbacks @ IJTSRD | Available Online @ www.ijtsrd.com | Volume – 2 | Issue – 1 | Nov-Dec 2017 Page: 1399
International Journal of Trend in Scientific Research and Development (IJTSRD) ISSN: 2456-6470 7.1.Tools used in Designing the GUI S. No. 1 Tools Functions Layout Editor Select components from the component palette, at the left side of the Layout Editor, and arrange them in the layout area. See Adding Components to the GUI for more information. Set the size at which the GUI is initially displayed when you run it. See Setting the GUI Size for more information. Create menus and context, i.e., pop-up, menus. See Creating Menus for more information. Align and distribute groups of components. Grids and rulers also Enable you to align components on a grid with an optional snap-to-grid Capability. See Aligning Components for more information. Set the tab and stacking order of the components in your layout. See Setting Tab Order for more information. Set the properties of the components in your layout. It provides a list of all the properties you can set and displays their current values. Display a hierarchical list of the objects in the GUI. See Viewing the Object Hierarchy for more information. Save and run the current GUI. See Saving and Running the GUI for Information. Display, in your default editor, the M-file associated with the GUI. See GUI Files: An Overview for more information. Table 1: Tools used in designing the GUI [5] Figure Resize Tab Menu Editor 2 3 Align Objects 4 Tab Order Editor Property Inspector Object Browser 5 6 7 Run 8 9 M-File Editor 7.2.Developing GUI for Modulation and Demodulation Step 1: Developing Graphical User Interface for Modulation and Demodulation using MATLAB. Begin to create MATLAB GUI by creating their figure file name fig-file. By typing ‘GUIDE’ at the command window, A GUIDE Quick Start window will prompt out [5] as shown in Figure 4 Figure 5 and Figure 6. Figure 4: MATLAB Command Window Figure 5: MATLAB GUIDE Quick Start Window @ IJTSRD | Available Online @ www.ijtsrd.com | Volume – 2 | Issue – 1 | Nov-Dec 2017 Page: 1400
International Journal of Trend in Scientific Research and Development (IJTSRD) ISSN: 2456-6470 Figure 6: Layout Editor with a blank GUI template display Step 2: Add function for GUI by dragging component from component palette. There is Push Button, Slider, Radio Button, Check Box, Edit Text, Static Text, Pop-up Menu, List Box, Toggle Button, Axes, Panel, Button Group, and Active X Control [5, 6]. For example, if you drag push buttons and axes into the layout area and arrange it and the same arrangements of push buttons and axis is shown in Figure 7. Figure 7: Showing Push Button, Static Text, Axes and Panel at the Lay out area Step 3: Open the Property Inspector at View > Property Inspector to change the name of pushbutton, Panel and other function name[5] as shown in Figure 8. @ IJTSRD | Available Online @ www.ijtsrd.com | Volume – 2 | Issue – 1 | Nov-Dec 2017 Page: 1401
International Journal of Trend in Scientific Research and Development (IJTSRD) ISSN: 2456-6470 Figure 8: Property Inspector Step 4: Run the GUI by click the run Button run button on the toolbar. This displays the functioning of GUI outside the Layout Editor. GUIDE stores a GUI in two files, which are generated the first time save or run the GUI: FIG-file, with extension .fig, which contains a complete description of the GUI layout and the components of the GUI: push buttons, menus, axes, and so on [5, 6].Figure 9 represents the GUI after the run command is executed. To run a GUI, select Run from the Tools menu, or click the Figure 9: After Click on RUN Button Step 5: M-file with extension .m, that contains the code controls the GUI, including the callbacks for its components. These two files correspond to the tasks of laying out and programming the GUI. When lay out of the GUI in the Layout Editor the works is stored in the FIG-file. While programming GUI the work is stored in the M- file [5, 6]. Step 6: After preparing the layout of the GUI, the programming of GUI can be done in M-file using the M-file editor. GUIDE automatically generates this file from your layout as soon as you save or run the GUI. The GUI M- file initializes the GUI that contains code to perform tasks before the GUI appears on the screen, such as creating data or graphics that contains callback functions that are executed each time a user clicks a GUI component. Initially, each callback contains just a function definition line. Use the M-file editor to add code that makes the component. To open the M-file, click the M-file Editor icon on the Layout Editor Toolbar. You can view the @ IJTSRD | Available Online @ www.ijtsrd.com | Volume – 2 | Issue – 1 | Nov-Dec 2017 Page: 1402
International Journal of Trend in Scientific Research and Development (IJTSRD) ISSN: 2456-6470 callback for any of the GUI components by clicking the function icon the callbacks, as shown in Figure 10. on the toolbar. This displays a list of all Figure 10: Editor Window with callbacks 8.Results The designed user interface is shown in Figure 11. Figure 11: Main GUI Window To initialize the signals, user can select desired options like AM, FM, ASK, FSK, SSB-SC, DSC-SC, and many more. The results obtained after designing the GUI are shown in below mentioned figures @ IJTSRD | Available Online @ www.ijtsrd.com | Volume – 2 | Issue – 1 | Nov-Dec 2017 Page: 1403
International Journal of Trend in Scientific Research and Development (IJTSRD) ISSN: 2456-6470 Figure 12: Modulation and Demodulation Graph of AM Figure 13: Modulation and Demodulation Graph of PPM Figure 14: Modulation and Demodulation Graph of FSK Figure 15: Modulation and Demodulation Graph of QPSK Figure 16: Modulation and Demodulation Figure 17: Modulation and Demodulation Graph of DSB-SC Graph of SSB-SC @ IJTSRD | Available Online @ www.ijtsrd.com | Volume – 2 | Issue – 1 | Nov-Dec 2017 Page: 1404
International Journal of Trend in Scientific Research and Development (IJTSRD) ISSN: 2456-6470 9.Conclusion In this paper the MATLAB based GUI is designed and described for various waveforms based on signal processing tool. The authors have tried their level best to make the Modulation and Demodulation tool as user friendly as possible. The purpose of the modulation and demodulation tool is to bring the various signals functions available in MATLAB tool box under one common platform and to make it easier for the understanding of any user. 10.References 1)Refaat Yousef Al Ashi, Ahmed Al Ameri, Prof. Abdulla Ismail Abdulla, Introduction To Graphical User Interface (GUI) Matlab 6.5, College Of Engineering, Electrical Engineering Department, IEEE UAEU Student Branch, UAE University. 2)Mistry Kaushik P, Prajapati Simpal K, Patel Jenish C, Machhi Devis M, A MATLAB Based GUI for Various Signals Testing and Analysis of Filter (IJSRD - International Journal for Scientific Research & Development| Vol. 3, Issue 02, 2015 | ISSN (online): 2321-0613). 3)https://www.quora.com/What-is-modulation-and- demodulation-in-a-modem 4)Stephen J. Chapman, MATLAB Programming for Engineers, 5th Edition, 2008. 5)Muhammad Lokman Al-Hakim Bin Abu Bakar, Graphical User Interface for Signal Generator, University Malaysia Pahang, Malaysia. 6)Online: http://www.mathworks.in/videos/creating- a-gui-with-guide-68979.html 7)https://www.tutorialspoint.com/analog_communicat ion/analog_communication_modulation.htm 8)http://physics.tutorvista.com/waves/modulation.htm l @ IJTSRD | Available Online @ www.ijtsrd.com | Volume – 2 | Issue – 1 | Nov-Dec 2017 Page: 1405