Download
1 / 37
470 likes | 839 Views
Transportation Engineering. Fundamentals of Traffic Signals . Why Traffic Signals? . Conflicting traffic movements, make roadway intersections unsafe for vehicles and pedestrians

E N D
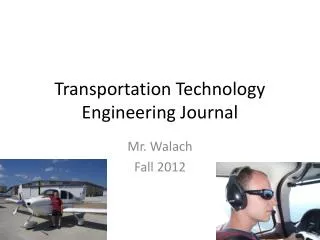
Transportation Engineering Fundamentals of Traffic Signals
Why Traffic Signals? • Conflicting traffic movements, make roadway intersections unsafe for vehicles and pedestrians • Intersections are a major source of crashes and vehicle delay (as vehicles yield to avoid conflicts with other vehicles).
Why Traffic Signals? • Most roadway intersections are not signalized due to low traffic volumes and adequate sight distances. • At some point, traffic volumes and crash frequency/severity (and other factors) reach a level that warrant the installation of traffic signals. MUTCD def: “Any power-operated traffic control device other than a barricade warning light or steady burning electric lamp, by which traffic is warned or directed to take some specific action.” Manual on Uniform Traffic Control Devices (MUTCD)
Signalised Intersection • Two simple examples in Dublin
History of Signalized Intersections 1868 - London, UK • Manually operated semaphores (flags) 1914 - Cleveland, OH • 1st Electric Signal 1917 - Detroit, MI • Amber colour introduced
Traffic Signals : Advantages • Ensures orderly movement of traffic in all directions • Provisions for the progressive flow of traffic in a signal-system corridor • Provisions for side-street vehicles to enter the traffic stream • Provisions for pedestrians to cross the street safely • Potential reduction of accidents, conflicts ensuring safety • Possible improvements in capacity, and • Possible reductions in delay
Traffic Signals : Disadvantages • Large stop time delay • Complex signal design problems The possible effects of a poorly-timed traffic signal : – increase in vehicle delay, – increase vehicle crashes (particularly rear-end crashes) – disruption to traffic progression
Performance Measures throughput
Terminology 1 • Green time: The time period in which the traffic signal has the green indication • Red time: The time period in which the traffic signal has the red indication • Yellow time: The time period in which the traffic signal has the yellow indication • Cycle: One complete rotation or sequence of all signal indications • Cycle time (or cycle length): The total time for the signal to complete one sequence of signal indication.
Terminology 2 • Permitted movement: A movement that is made through a conflicting pedestrian or other vehicle movement. This is commonly used for right-turning movements where right-turn volumes are reasonable and where gaps in the conflicting movement are adequate to accommodate turns. • Protected movement: A movement that is made without conflict with other movements. The movement is protected by traffic control signal design with a designated green time for the specific movement.
Terminology 3 • Effective green time: The effective green time, for a phase, is the time during which vehicles are actually discharging through the intersection. • Lost Time: A portion of green or yellow time which is not utilised by traffic flow movements in a cycle. • Start-up lost time:At the beginning of each green indication as the first few cars in a standing queue experience start-up delays. This delay is measured as start-up lost time. • The clearance lost time: It is estimated by the amount of the yellow time not used by vehicles.
Basic Concepts of Intersection Signalisation • Discharge headways • Saturation flow at signalised intersections • Delay • Level of Service
Discharge Headways • Consider N vehicles discharging from the intersection when a green indication is received. • The first discharge headway is the time between the initiation of the green indication and the rear wheels of the first vehicle to cross over the stop line. • The Nth discharge headway (N>1) is the time between the rear wheels of the N-1th and Nth vehicles crossing over the stop line.
Discharge Headways • The headway begins to level off with 4 or 5th vehicle. • The level headway = saturation headway
Saturation flow rate In a given lane, if every vehicle consumes an average of h seconds of green time, and if the signal continues to be uninterruptedly green, then S vph could enter the intersection where S is the saturation flow rate (vehicles per hour of green time per lane) given by
Saturation Flow Rate • A variable directly related to discharge headway • In a given lane, if every vehicle consumes an average of h seconds of green time, and if the signal continues to be uninterruptedly green, then S vehicles per hour (vph) could enter the intersection where S is the saturation flow rate given by • In other words, s for a lane group/approach is the maximum number of vehicles from that lane group/approach that can pass through the intersection during one hour of continuous green time under the prevailing traffic and roadway conditions.
Saturation Flow Rate • The saturation flow rate is normally given in terms of straight-through passenger cars per hour of green. • Passenger Car Units: A unit of measure whereby HOVs and turning movements are converted to straight-through passenger cars using multiplication factors. This allows to deal with mixed traffic streams more accurately than assuming that all vehicles are equal. • Unit for a single lane: vphgpl (vehicles per hour of green time per lane) Here, vehicle is equivalent to passenger car units (pcu) • Unit for an approach : vphg (vehicles per hour of green time) or pcuphg (passenger car units per hour of green time)
Factors Affecting Saturation Flow • Position of lane • Lane width • Approach grades • Parking conditions • Number of HOVs • Number of turning vehicles • Conflicting vehicular flow • Conflicting pedestrian flow We will be only considering the geometric factors
Non-opposed Streams • For non-opposed streams saturation flow , s1for individual lanes is given by,
Capacity The maximum hourly rate at which persons or vehicles can be reasonably expected to traverse a point or uniform segment of a lane or roadway during a given time period under prevailing traffic and roadway conditions. (HCM 2000) • Unlike saturation flow, capacity considers traffic signal conditions The formula for calculating capacity (c) is, c = (g/C) · s · N Where:c = capacity (pcu/hour)g = Effective green time for the phase in question (sec)C = Cycle length (sec) N = no. of laness = Saturation flow rate (pcu/hour)
Capacity Calculation • Capacity can be calculated for two categories of flow: uninterrupted and interrupted. • Uninterrupted-flow facilities • no fixed elements external to the traffic stream to interrupt flow • Motorways, multilane highway, dual carriageway • Interrupted-flow facilities • have controlled and uncontrolled access points that can interrupt flow • signalised and non-signalised intersections, urban streets
Delay • Very important performance measure for intersection signal design • A measure most directly related to Driver’s experience • Stopped Time Delay: time a vehicle stopped waiting to pass the intersection. • Approach Delay: stopped time + acceleration + deceleration • Travel Time Delay: (actual travel time-desired travel time) • Time-in-queue Delay: Total time from joining a queue to passing the stop line • Delay is affected by cycle time, green time and volume to capacity ratio
Delay • Total delay • Stopped delay • Time in queue delay
Level of Service (LOS) • The performance of a signalised intersection is measure considering the average stopped time delay. • The delay experienced by the average vehicle can be directly related to a level of service (LOS). • The LOS categories, contain information about the progression of traffic under the delay conditions that they represent. • The first step in the LOS analysis is to calculate the average delay per vehicle for various portions of the intersection. The LOS of can be calculated for an entire approach, or alternatively, for each individual lane.
Level of Service (Highways) LOS A LOS B LOS C LOS D LOS E LOS F
LOS • Level of Service A - Operations with low delay, or delays of less than 5.0 seconds per vehicle. This LOS is reached when most of the oncoming vehicles enter the signal during the green phase, and the driving conditions are ideal in all other respects as well. • Level of Service B - Operations with delays between 5.1 and 15.0 seconds per vehicle. This LOS implies good progression, with some vehicles arriving during the red phase. • Level of Service C - Operations with delays between 15.1 and 25.0 seconds per vehicle. This LOS witnesses longer cycle lengths and fair progression.
LOS • Level of Service D - Operations with delays between 25.1 and 40.0 seconds per vehicle. At this LOS, congestion is noticeable and longer delays may result from a combination of unfavorable progression, long cycle lengths, and high V/c ratios. • Level of Service E - Operations with delay between 40.1 and 60.0 seconds per vehicle. This LOS is considered unacceptable by most drivers. This occurs under over-saturated intersection conditions (V/c ratios over 1.0), and can also be attributed to long cycle lengths and poor progression.