Download
1 / 16
160 likes | 283 Views
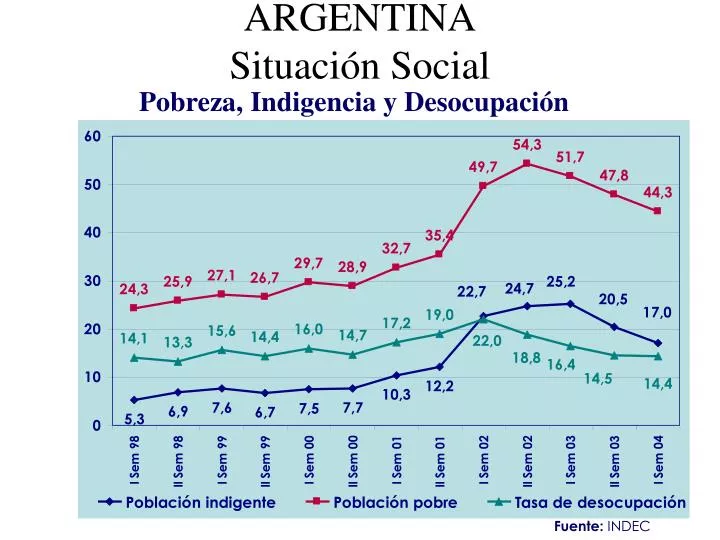
ARGENTINA Situación Social. Pobreza, Indigencia y Desocupación. Fuente: INDEC. Evolucion de la poblacion total, PEA y Beneficiarios de la Seguridad Social Nacional (en millones de personas). Argentina. Evolución del gasto total en salud como porcentaje del PBI 1995-2003.

E N D
ARGENTINASituación Social Pobreza, Indigencia y Desocupación Fuente: INDEC
Evolucion de la poblacion total, PEA y Beneficiarios de la Seguridad Social Nacional(en millones de personas)
Argentina. Evolución del gasto total en salud como porcentaje del PBI 1995-2003.
GASTO EN SALUD (en millones de $) y COBERTURA POR SECTORES (en millones de habitanes) 2003 SECTOR SEGURIDAD SOCIAL SECTOR PÚBLICO SECTOR PRIVADO 20,22 14,92 2,8 DIRECTO $ 9.403 (u$s 3.134) $ 8.085 (u$s 2.695) $ 6.826 (u$s 2.275) $ 3.517 (u$s 1.172) TOTAL $ 27.833 (u$s 9.277) $ 733,53 por hab./año (u$s 244,51)
SUBSECTOR SEGURIDAD SOCIAL 20.22 MILL
Ingresos según tramos de los titularesSegún DDJJ AFIPMes de mayo 2005-N=4.756.676
PIRÁMIDE DE POBLACIÓN POR SEXO 2001 (distribución proporcional) HOMBRES MUJERES > - 80 EDAD 75 - 79 70 - 74 65 - 69 60 - 64 55 - 59 50 - 54 45 - 49 40 - 44 35 - 39 30 - 34 25 - 29 20 - 24 15 - 19 10 - 14 5 - 9 0 - 4
HABITANTES ARGENTINA 37.944.014 SUBSECTOR PRIVADO 2,8 MILLONES 7% SUBSECTOR PÚBLICO 14,92 MILLONES 39% SUBSECTOR SEGURIDAD SOCIAL 20,22 MILLONES 54%
Administración de Programas Especiales Pagos por Tipo de Prestación desde el 01/01/2001 al 31/12/2004.
Administración de Programas Especiales Pagos desde el 01/01/2001 al 31/12/2004.
Administración de Programas Especiales Beneficiarios del año 2004 por Tipo de Prestación.