Download
1 / 21
220 likes | 332 Views
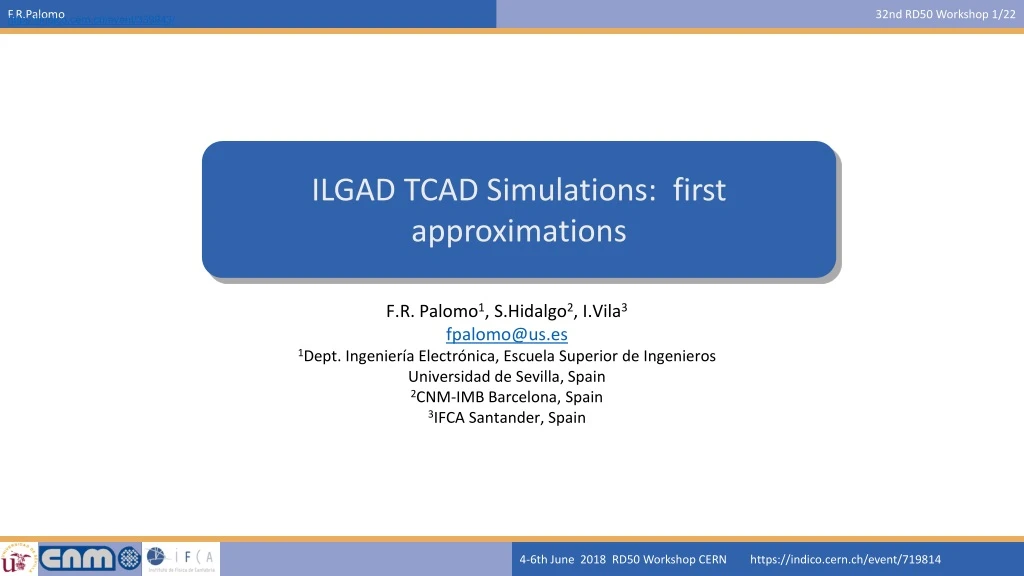
ILGAD TCAD Simulations: first approximations. F.R. Palomo 1 , S.Hidalgo 2 , I.Vila 3 fpalomo@us.es 1 Dept. Ingeniería Electrónica , Escuela Superior de Ingenieros Universidad de Sevilla , Spain 2 CNM-IMB Barcelona, Spain 3 IFCA Santander, Spain. Introduction.

E N D
ILGAD TCAD Simulations: first approximations • F.R. Palomo1, S.Hidalgo2, I.Vila3 • fpalomo@us.es • 1Dept. IngenieríaElectrónica, Escuela Superior de Ingenieros • Universidad de Sevilla, Spain • 2CNM-IMB Barcelona, Spain • 3IFCA Santander, Spain
Introduction • Development of several ILGAD models to test gainvariationwithbias and n+/pwell doping • Improvement in the ILGAD modelscomparedwith experimental data • Analisis of radiationeffects in ILGAD • 300um New Perugia Trap + KrambergerAcceptorremovalmodels • 50um New Perugia Trap+ KrambergerAcceptorremovalmodels
Sentaurus TCAD SimulationSetUp P1Left P1Right 50 mm InverseLowGainAvalanche Detector (ILGAD) cross-section 30 mm y x z • SimulationSetup: • Red Pulsed Laser: 670 nm, 10 mm spot, 50W/cm2, 200 ps, • BackIllumination at P1 Right • FrontIlluminationalignedwith P1 Right • IR Pulsed Laser: 1064nm, 30W/cm2,10 mm spot, 30W/cm2, 200 ps at P1 Right • 2D detector model: 1 mm in Z direction, 5 mm in X direction, • 300/50 mm in Y direction) Doping profilesunderconfidenciality rules
ILGAD IV Experimental Experimentallywesee a full depletion at the n++-p junction (multiplicationlayer) around 30V and a softbehaviour in the IV plot up to ~400 V I.Vila, Updateonthe ILGAD characterization, RD50 Nov 22th 2016
ILGAD IV Simulation 300mm ILGAD 50mm ILGAD Both ILGAD models (300 mm, 50 mm thickness) show full depletion at n++-p (multiplicationlayer) around 30 V, as expected. Forthe 300 mm wechoose 150V, 300V, 450V as biasvoltage, forthe 50 mm wechoose 50V, 100V, 150V as biasvoltage
ILGAD 300 mm Red Laser Back Transient: Simulation shows gain (~4) Laser 670nm (red), illuminatingon P1 rightstrip (just in themiddle), signalobserved in the N electrode (cathode). Comparing ILGAD and itsassociated PIN (PINILGAD) theplot shows a gain factor around 4 (modelverification).
ILGAD Red Laser Back Transient Experimental 300K Experimental data illuminatingtheanode (back side), with a red laser (670nm) in the P1 Rightstrip I.Vila, Updateonthe ILGAD characterization, RD50 Nov 22th 2016
ILGAD 300 um Red Laser (670nm) Back Transient P1Right Q 450V 9,22e-16C Q 300V 8,24e-16C Q 150V 7e-16C PrimaryElectrons Q PINILGAD~2,9e-16C MultiplicationOnset Secondary Holes
ILGAD Red Laser Front Transient Experimental 300K Experimental data illuminatingthecathode (frontside), with a red laser (670nm) allignedwith P1 Rightstrip I.Vila, Updateonthe ILGAD characterization, RD50 Nov 22th 2016
ILGAD 300mm Red Laser (670nm) Front Q 450V 9,41e-16C Q 300V 8,34e-16C Q 150V 7e-16C Primary and Secondaryholecurrent MultiplicationOnset Q PINILGAD~2,6e-16C
LGAD IR Laser Experimental Results Experimental data TCT laser (IR, 1064nm) allignedwith P1 Rightstrip I.Vila, Updateonthe ILGAD characterization, RD50 Nov 22th 2016
ILGAD 300um IR (1064nm) Laser Q 450V 2,55e-16C Q 300V 2,30e-16C Q 150V 2,1e-16C Q PINILGAD~6,98e-17C
ILGAD 50 um Red Laser (670nm) Back Transient P1Right Q 450V 9,21e-15C Q 100V 1,19e-15C Q 50V 9,21e-16C Q PINILGAD~2,9e-16C
ILGAD 50 um IR (1064nm) Laser Transient P1Right Q 150V 1,24e-16C Q 100V 1,02e-16C Q 50V 2,47e-17C Q PINILGAD~2,47e-17C
RadiationDamageModels Onedamagemodel, Traps+AcceptorRemoval New Perugia Modelf =1e15 up to 7,5e15 neq/cm2 AcceptorRemoval New Perugia c=10e-16 cm-2 Radiationeffects in LowGainAvalancheDetectorsafterhadronirradiations, G.Kramberger et al., JINST 2015 10 P07006 Modeling of radiationdamageeffects in silicondetectors at highfluences HL-LHCwithSentaurus TCAD, D.Passeri et al, NIMA 824 (2016), 443-445
Conclusions • The ILGAD model shows reasonableagreementwithexperiments (experimental resultsavailable are for a similar model, no exactlythesame). • Thetimingbehavior (risingedge) at the central rightanodestrip shows no dependencewithradiation • Thegain and signal general behaviourunderirradiationis similar to the LGAD as expected • As expected, the 50 mm device shows betterbehaviourunderradiation
Thanksforyourattention fpalomo@us.es