Download
1 / 9
100 likes | 133 Views
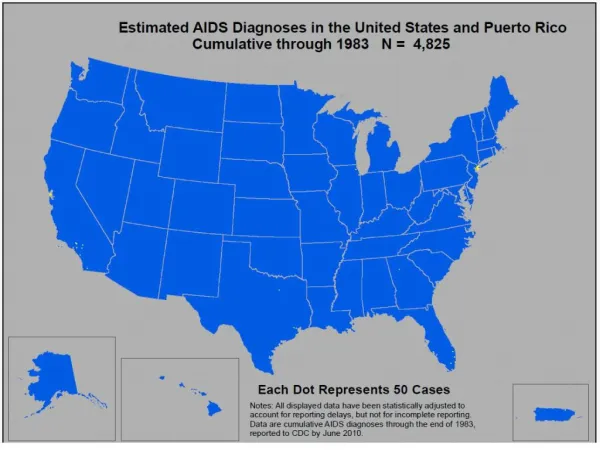
Choropleth Map. How can such different looking maps show the same variable?. Cartographic reasons Different slicing values Different levels of spatial aggregation Geographical reasons Uneven distribution of minorities at the state scale as well as at the national scale

E N D
How can such different looking maps show the same variable? Cartographic reasons Different slicing values Different levels of spatial aggregation Geographical reasons Uneven distribution of minorities at the state scale as well as at the national scale Concentration of minorities in cities, particularly in northern states
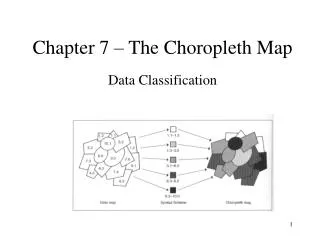
Different ways of “slicing” data The Data {42, 50, 55, 57, 61, 77, 79, 97} Equal interval Three classes based on range 40 to 100 {42, 50, 55, 57} {61, 77, 79} {97} Quantile Quartiles (lowest 1/4 of observations, next 1/4, …) {42, 50} {55, 57} {61, 77} {79, 97}
Different ways of “slicing” data Natural breaks {428505552574616772791897} {42} {50, 55, 57, 61} {77, 79} {97} Standard deviations Mean = 64.75, Std. Dev. = 15.977 {42} {50, 55, 57, 61} {77, 79} {97}
Quintiles Natural Breaks Equal Interval