Download
1 / 34
340 likes | 447 Views
NAEP 2011 Mathematics and Reading Results. NAEP State Coordinator Mark DeCandia. What is NAEP?. The National Assessment of Educational Progress (NAEP) is the largest continuing and nationally representative assessment of what our nation’s students know and can do in core subjects.

E N D
NAEP 2011 Mathematics and Reading Results NAEP State Coordinator Mark DeCandia
What is NAEP? • The National Assessment of Educational Progress (NAEP) is the largest continuing and nationally representative assessment of what our nation’s students know and can do in core subjects. • A survey designed to produce national, state, and select urban district level results. • NAEP results are for populations of students, not for individual students nor schools. • Measures student performance nationally and reports changes over time. • Allows comparisons between states and the nation.
NAEP School and Student Selection • NAEP uses a carefully designed sampling procedure for the assessment to be representative of the geographical, racial, ethnic, and socio-economic diversity of schools and students in the state. • First, schools are selected to be representative of schools. • Then, within each chosen school students are randomly selected to participate. Each participating student represents hundreds of other similar students.
NAEP Administration • NAEP is administered over a six-week period. • For 2011: January 24th – March 4th • About 3,000 students in approximately 100 schools are selected in each state for each grade and subject. • Each student is only assessed in one subject area. • Students only take a small portion of the assessment • Accommodations are provided as necessary for students with disabilities and English language learners.
NAEP Results • The results of NAEP are released as The Nation’s Report Card. • The report card provides national, state, and district-level results, results for different demographic groups, inclusion information, and sample questions. • NAEP Results are reported in two formats • Average Scale Scores • Numeric scale • 0 − 500 on mathematics and reading assessments • Scores cannot be compared across content areas • Achievement Levels • Categorical scale • Below Basic, Basic, Proficient, Advanced
2011 RESULTSNation’s Report Card (NAEP)MathematicsGrades 4 & 8
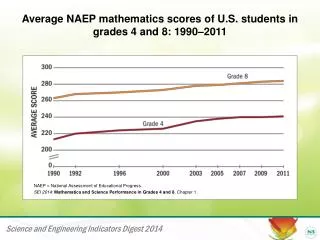
Math 4th Grade Average Scale Scores Over Time NOTE: Observed differences are not necessarily statistically significant.
During 2011 - 4th Grade Math Students in 9 states/jurisdictions score higher than in 2009, and students in 1 state score lower 1 Department of Defense Education Activity (overseas and domestic schools).
Math 4th Grade 2011 Achievement Levels NOTE: Observed differences are not necessarily statistically significant. Percentages might not sum to 100 due to rounding.
Math 4th Grade Score Gap Comparison: NSLP Not Eligible and Eligible National Public Kentucky NOTE: Observed differences are not necessarily statistically significant.
Math 8th Grade Average Scale Scores Over Time NOTE: Observed differences are not necessarily statistically significant.
During 2009 - Change in State Scores Between 2007 and 2009 for Grade 8 Math 15 Scores increase since 2007 in 15 states, and no states decline
During 2011 - 8th Math Grade Students in 13 states/jurisdictions score higher than in 2009, and students in 1 state score lower 1 Department of Defense Education Activity (overseas and domestic schools).
Math 8th Grade 2011 Achievement Levels NOTE: Observed differences are not necessarily statistically significant. Percentages might not sum to 100 due to rounding.
Math 8th Grade Score Gap Comparison: NSLP Not Eligible and Eligible National Public Kentucky NOTE: Observed differences are not necessarily statistically significant.
Reading 4th Grade Average Scale Scores Over Time NOTE: Observed differences are not necessarily statistically significant.
During 2009 - Scores increase since 2007 in 3 states and decrease in 4 states
During 2011 - 4th Grade Reading Students in 4 states score higher than in 2009, and students in 2 states score lower 1 Department of Defense Education Activity (overseas and domestic schools).
Reading 4th Grade2011 Achievement Levels NOTE: Observed differences are not necessarily statistically significant. Percentages might not sum to 100 due to rounding.
Reading 4th GradeScore Gap Comparison:NSLP Not Eligible and Eligible National Public Kentucky NOTE: Observed differences are not necessarily statistically significant.
Reading 8th GradeAverage Scale Scores Over Time NOTE: Observed differences are not necessarily statistically significant.
During 2009 – 8th Grade Reading Scores increase since 2007 in 9 states, and no states decline
During 2011 - 8th Grade Reading Students in 10 states score higher than in 2009, and no states score lower 1 Department of Defense Education Activity (overseas and domestic schools).
Reading 8th Grade 2011 Achievement Levels NOTE: Observed differences are not necessarily statistically significant. Percentages might not sum to 100 due to rounding.
Reading 8th Grade Score Gap Comparison: NSLP Not Eligible and Eligible National Public Kentucky NOTE: Observed differences are not necessarily statistically significant.
For more information http://nationsreportcard.govThanks for learning about Kentucky’s NAEP data on our Nation’s Report Card!