Download
1 / 31
310 likes | 477 Views
Regional and temporal trends in semi-empirical estimates of aerosol water concentration in the continental U.S. R835041. Thien Khoi V. Nguyen 1 Annmarie G. Carlton 1 Shannon L. Capps 2. 1 Rutgers University

E N D
Regional and temporal trends in semi-empirical estimates of aerosol water concentration in the continental U.S. R835041 Thien Khoi V. Nguyen1 Annmarie G. Carlton1 Shannon L. Capps2 1 Rutgers University 2 U.S. Environmental Protection Agency through Oak Ridge Institute for Science and Education CMAS 2014 Annual Conference
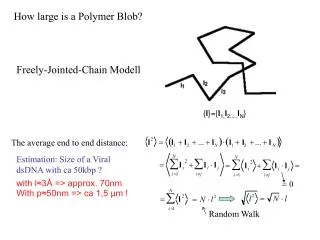
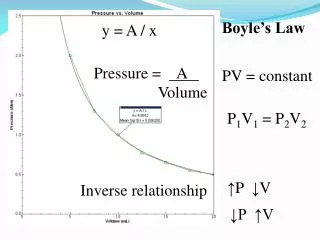
Introduction & Motivation • Aerosol water • Condenses onto existing aerosol particles as f(RH, T, aerosol and gas phase concentration & composition) • Why is aerosol water important? • Atmospheric aqueous chemistry (partitioning medium) • Visibility impairment • Influences climate • What are the regional & temporal trends in aerosol water?
Model Description Inorganic aerosol thermodynamics model ISORROPIA v2.1(Nenes et al., 1998, Fountoukis and Nenes, 2007) • Assumes a NH4-SO4-NO3metastablesystem • Provides low boundary for water content
Southeastern U.S. Southeastern Aerosol Research and Characterization (SEARCH) • Why Southeastern U.S.? • Recent Southern Oxidant and Aerosol Study (SOAS) & other SAS field campaigns • Biogenic carbon and anthropogenic pollutants combine to form a cooling haze over the southeastern United States (Goldstein et al., 2009) • Liquid water dominant aerosol constituent in the Eastern US (Carlton and Turpin, 2013) • SEARCH network monitored by the Atmospheric Research & Analysis, Inc. (ARA) (Hansen et al. 2003; Edgerton et al. 2005, 2006) • Years: 2001-2010
Trends ~70% decrease in overall water Average water concentrations at CTR in 2013: 4 µg m-3 (Nguyen et al., 2014)
Urban vs. Rural Temperature RH oC Nitrate Sulfate µg m-3 µg m-3
Monthly Trends by RH • Water content decreases after ~2006 • Ultra-low S fuel introduced late 2006/early 2007 • May-Oct: most noticeable decrease in water concentrations --- __ Data screened for forest fires: [CO] > 700 ppb Raw data
Trends [Organic aerosol] ↓ in S.E. US (Blanchard et al., 2013)
Discussion [Organic aerosol] ↓ in S.E. U.S. Why?
Discussion [Organic aerosol] ↓ in S.E. U.S. Why? Possible Reasons: Anthropogenic [VOCs] ↓ Primary non-fossil [OC] ↓ Temperature ↑ Acidity effects [Aerosol water] ↓ …
Modern vs. Fossil Carbon [Organic aerosol] ↓ in S.E. U.S. Why? Anthropogenic [VOCs] ↓? Not main driving factor, SE SOA is primarily biogenic, even in urban areas (Weber et al., 2007; Lewis et al., 2004; Lemire et al., 2002) Weber et al., 2007
Biogenic OC • [Organic aerosol] ↓ in S.E. U.S. Why? • Primary non-fossil [OC] ↓? • No, forest fires have been increasing (NIFC, 2008) and presumably fire-related [OC] (Park et al., 2003) • No, ambient [isoprene] ↑ index for primary biogenic OC emissions Photochemical Assessment Monitoring Stations (PAMS) in SEARCH states
Temperature effects • [Organic aerosol] ↓ in S.E. U.S. Why? • Temperature ↑? • No, although compounds may vaporize at high temperatures, temperatures have been decreasing
Acidity effects [Organic aerosol] ↓ in S.E. U.S. Why? Acidity effects? Unclear. Isoprene epoxydiol (IEPOX) chemistry activated by H+ transfer from strong acid and nucleophilic addition; enhanced in the presence of acidified sulfate seed aerosol; chemical system is nucleophile-limited (Surratt et al., 2010, Nguyen et al., 2014) Use ion-charge balance to calculate an index for acidity pH index = - log ((1000 * H+)/(Vw,i+Vw,o)) H+ = (2*SO4/96+NO3/62-NH4/18) For Vw,o, κorg~ 0.1 Correlation with OC trends: R2: 0.08, p-value: 0.44
Aerosol water [Organic aerosol] ↓ in S.E. U.S. Why? [Aerosol water] ↓?Yes. Medium to partition polar, water-soluble gas phase organic species (Asa-Awuku et al., 2010, Prisle et al., 2010, Carlton and Turpin, 2013) Water vs. time: R2 = 0.69, p-value = 0.0029 Water fraction vs. time: R2 = 0.52, p-value = 0.0019 Water trend vs. Organic trend: R2= 0.70, p-value = 0.0026
Trends • [Organic aerosol] ↓ in S.E. U.S. Why? • Anthropogenic [VOCs] ↓ Not main driving factor • Primary non-fossil [OC] ↓ No • Temperature ↑ No • Acidity effects Uncertain • [Aerosol water] ↓ Yes • …
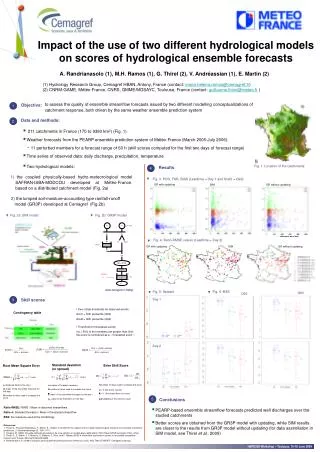
July 2003 average July 2003 average, CMAQv4.7 using ISORROPIA Adapted from Carlton and Turpin, 2013 Simulation details in Carlton et al., 2010
Regional comparison for 2003 Meteorological & modeled inorganic ion data from Carlton et al., 2010 ISORROPIA v2.1
Zhang et al., 2007 Ubiquity and dominance of oxygenated species in organic aerosols in anthropogenically‐influenced Northern Hemisphere mid-latitudes
World comparison Using avgT & RH data from 2014 summer solstice & AMS data (Zhang et al., 2007) µg m-3 Water 1.4 0.2 6.4 2.3 1.5 0.9 37.5 5.8 3.6 3.1 9.1 16.8 1.7 0.7 8.0 0.3 1.0 7.2 ISORROPIA v2.1
Conclusions • Aerosol water in the SE US • Decreased by ~70% between 2001-2010, possibly due to improvements in emissions • Most noticeable decrease in water concentrations: after 2006 and between May and October • Rural water > urban water • Organic aerosols in the SE US • Decreasing organic aerosol trends are consistent with decreasing trends in aerosol water; acidity effects unclear • Aerosol water elsewhere • Lots of water in NE, SE, and Midwest, but not much in Central, West, or West Pacific • High water concentrations in places with high levels of sulfate (e.g., Beijing, Pittsburgh)
Acknowledgements • Atmospheric Research and Analysis, Inc. • Environmental Protection Agency • National Science Foundation: AGS-1242155 • U.S. Department of Education • Carlton group at Rutgers • Barbara Turpin & group • Eric Edgerton, ARA R835041 Although this presentation has been reviewed by EPA and approved for presentation, it does not necessarily reflect official EPA agency views or policies.
Water uptake by organics In laboratory studies, organic compounds ubiquitous in the troposphere (e.g., methylglyoxal and acetaldehyde) increase particle hygroscopicity(Sareen et al., 2013) Adapted from Petters and Kreidenweis, 2007 κorg ~ 0.01-0.2
Model comparison for SOAS ISORROPIASMPS Water (µg m-3) RH < 99% Hours past midnight ISORROPIA ran with SEARCH ion and met data SMPS hygroscopicity data from Nguyen et al., 2014 adjusted to SEARCH RH using P&K eqn.