Download
1 / 12
120 likes | 281 Views
How to build frequency tables. For Categorical and Numerical data. Frequency Tables: Categorical. Rows are called classes Each categorical (discrete) value occupies its own class Then frequency is counted for each class in absolute (#) and in relative (%) terms. Example. Variable: Gender

E N D
How to build frequency tables For Categorical and Numerical data
Frequency Tables: Categorical • Rows are called classes • Each categorical (discrete) value occupies its own class • Then frequency is counted for each class in absolute (#) and in relative (%) terms.
Example • Variable: Gender • Nature: Categorical, Nominal. • Values: Male, Female • Raw Data: {M, M, F, M, M, F, F, F, F, F, M, M, F, F, F, F, M, M, F, F}
Frequency Tables: Numerical • Rows are called classes • The number of classes, c, is a function of the number of observations, n: C = 1 + 3.3*LOG(n) –Sturge’s law If n = 50, then c ≈ 6.6
Frequency Tables: Numerical • Each class consists of a range of values know as the “class width”, w. • The class width must be the same for all classes. • W = Range ÷ c, where Range = MAX-MIN • If MIN = 82 and MAX = 213 for n=50 observations, then: W = (213 – 82) / 6.6 ≈ 20
Frequency Tables: Lower Class Limits • To build classes, we then start measuring class widths FROM a “nice” (round) number smaller than MIN. • The LOWER CLASS LIMITS are “c” numbers that are 1 class width, “w”, greater than the previous one.
Frequency Tables: Upper Class Limits • UPPER CLASS LIMITS mark ending values for each class. • They are smaller in value than the LOWER CLASS LIMITS of the previous classes.
Example: 2.12 on page 57, UTILITY Data: n=50, MIN=82, MAX=213 Range = 213 – 82 = 131 C = 1 + 3.3*LOG(50) ≈ 7 W = 131 / 7 ≈ 20 Frequency Table Class Limits: Frequency Tables: Value Classes Example
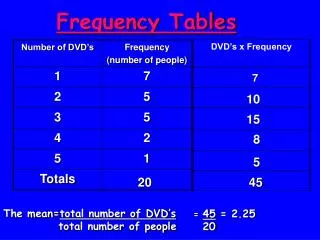
Frequency Table: absolute and % counts • To complete a frequency table we then tally how many observations in a data set fall in each of the previously formed class ranges. • These tallies can be accounted for in units or in % of the total number of observations, n.
Frequency Tables: using PhStat • To count frequencies, all you do is let PhStat do the tallying for you, using the command sequence: • PhStat • Descriptive Statistics • Frequency Distribution … • Then, you input the proper cell ranges in the dialog box for the procedure: • Variable cell range: range of cells for data. • Bins cell range: class limits for classifying data.