Download
1 / 11
110 likes | 247 Views
Chapter 3 Review Examining Relationships. Group Members: Stav Leibou , David Green . The Big Idea. In this chapter, we study about relationships between two quantitative variables. The two types of variables that we see are explanatory and response variables.

E N D
Chapter 3 ReviewExamining Relationships Group Members: StavLeibou, David Green
The Big Idea • In this chapter, we study about relationships between two quantitative variables. • The two types of variables that we see are explanatory and response variables. • Data analysis begins with graphs, and then adds numerical summaries to the data. • Scatterplots show the relationship between two variables.
More Big Ideas • Correlation describes the strength of a linear relationship, and must be between 1 and -1. • The LSRL is a model that we fit to our data. • Residual plots and r^2 help us assess how well the linear model fits the data. • Lurking Variables can alter the relationship between two variables.
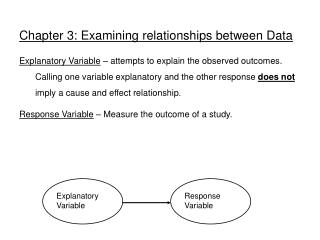
Vocabulary You Need To Know • A response variable measures the outcome of a study, and an explanatory variable helps explain or influences changes in a response variable. • A scatterplot is the most effective way to show a relationship between two variables. • Remember when describing the overall pattern of a scatter plot; direction, form, and strength of the relationship.
Vocabulary You Need to Know • An outlier is an individual that falls outside the pattern of the relationship. Correlation Measures the direction and strength of the linear relationship between two quantitative variables. • A regression line is a line that describes how a response value changes as an explanatory variable changes. • Extrapolation is using the regression line to predict values outside of what we are given.
Vocabulary you need to know • A residual is the difference between an observed value of the response variable and the predicted value. • There is a number called the coefficient of determination that tells us how well our LSRL is at predicting points. • A lurking Variable is a variable that is not among the explanatory or response variables, but may still influence the results in the study.
Key Topics Covered in this Chapter • Some of the Key topics discussed in this unit were: Data, Scatterplots, Correlation, regression Lines, Assessing Model Quality, and Interpreting Correlation and regression.
Formulas you should know • Y = a + bxRegression Equation b=slope a=y-int. • Y hat = a + bx Equation for LSRL • Residual = observed y - predicted y
Calculator Key Strokes • Regression Equation – stat, enter, enter your points, stat, right arrow to calc, 8. • Residuals- stat, enter, enter points, get the regression equation into your calculator, 2nd, stat, arrow down to resid.
practice • The graph gives you data on true calories of 10 foods and the average guesses made by a large group of people. • A)make a scatterplot suitable for predicting guessed calories from true calories • B) Use your calculator to calculate the LSRL of guessed calories and true calories. • C) plot both lines on your graph.
Practice • Food guessed calories correct calories 8 oz. milk 196 159 5 oz spaghetti 394 163 5 oz. Macaroni 350 269 One slice wheat bread 117 61 One slice white bread 136 76 2 oz candy bar 364 260 Saltine cracker 74 12 Medium sized apple 107 80 Medium sized potato 160 88 Cream filled snack cake 419 160