Download

1 / 10
100 likes | 163 Views
Learn to construct confidence intervals for the mean of a population using one-sample t procedures. Practice with a sample on NOX levels emitted by light-duty engines. Understand robustness of t procedures and how to account for outliers.

E N D
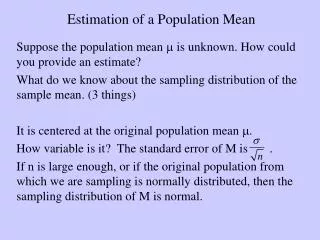
AP Exam Registration Deadline: March 17th Late Fee ($50): March 18th – March 24th Get out homework! Inference for the Mean of a Population Section 11.1 – Continued
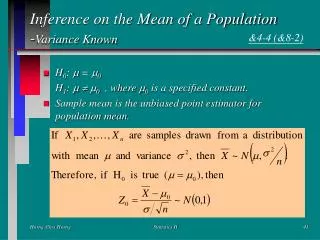
One-sample t procedures Draw an SRS of size n from a population having unknown mean µ. A level C confidence interval for µ is where t* is the upper (1 – C)/2 critical value for the t (n – 1) distribution.
Example 11.2, p.622 – 623 Environmentalists, government officials, and vehicle manufacturers are all interested in studying the auto exhaust emissions produced by motor vehicles. The major pollutants in auto exhaust are hydrocarbons, monoxide, and nitrogen oxides (NOX). The following table gives the NOX levels (in g/mi) for a sample of light-duty engines of the same type. Construct a 95% interval for the mean amount of NOX emitted by light-duty engines of this type.
Construct a 95% interval for the mean amount of NOX emitted by light-duty engines of this type. State: Identify the parameter you want to estimate and confidence level. We want to estimate µ, the mean amount of NOX emitted by light-duty engines of this type, at a 95% confidence level.
Construct a 95% interval for the mean amount of NOX emitted by light-duty engines of this type. Plan: Choose your procedure. Verify conditions. Procedure: means, t-procedure Conditions: 1. SRS 2. Independent 3. Normal 46*10 = 460 Assume there are more engines. Assume 46 ≥ 30, approx. normal by CLT.
Construct a 95% interval for the mean amount of NOX emitted by light-duty engines of this type. Do: If conditions are met, calculate the interval. Calculate = s = Df = n – 1 = 1.329 .484 45 So t*= 2.021 =
Construct a 95% interval for the mean amount of NOX emitted by light-duty engines of this type. Conclude: Write your results in context. We are 95% confident that the true mean level of nitrogen oxides emitted by this type of light-duty engine is between 1.185 grams/mile and 1.473 grams/mile.
Robust Procedures • A confidence interval or significance test is called robust if the confidence level or P-value does not change very much when the assumptions of the procedure are violated. • t procedures are relatively robust when the population is non-normal, especially for larger samples. IMPORTANT: t procedures are strongly influenced by outliers. (example 11.6)
Using the t procedures – (p. 636) • Assumption that data are an SRS from the population is more important than the assumption that the population is normal (except with small samples) • Sample size < 15. Use if the data are close to normal. If outliers are present, do not! • Sample size ≥ 15. Can be used except when there are outliers and distribution is skewed. • Large samples (roughly n ≥ 40). Can be used even for skewed distributions.
Homework: • P. 628: 11.10 b, c Due: Wednesday FYI: I have a meeting Friday morning, 3/8. I will have to cancel tutoring that day. I will have tutoring on Thursday morning at 8:45 – 9:15.