Download
1 / 34
340 likes | 531 Views
PART 2: Statistical Pattern Classification : Optimal Classification with Bayes Rule. METU Informatics Institute Min 720 Pattern Classification with Bio-Medical Applications. Statistical Approach to P.R. Dimension of the feature space : Set of different state s of nature: Categories:

E N D
PART 2: StatisticalPatternClassification: Optimal ClassificationwithBayesRule METU Informatics InstituteMin 720 Pattern Classification with Bio-Medical Applications
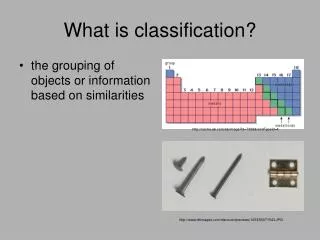
Statistical Approach to P.R Dimension of the feature space: Set of different states of nature: Categories: find set of possible actions (decisions): Here, a decisionmightinclude a ‘rejectoption’ A DiscriminantFunction in region ; decision rule :if
A Pattern Classifier So our aim now will be to define these functions to minimize or optimize a criterion.
Parametric Approach to Classification • 'BayesDecisionTheory' is used for minimum-error/minimum risk pattern classifier design. • Here, it is assumed that if a sample is drawn from a class it is a random variable represented with a multivariate probability density function. ‘Class- conditional density function’
We also know a-priori probability • (c is no. of classes) • Then, we can talk about a decision rule that minimizes the probability of error. • Suppose we have the observation • This observation is going to change a-priori assumption to a-posteriori probability: • which can be found by the Bayes Rule.
can be found by Total Probability Rule: • When ‘s are disjoint, • Decision Rule: Choose the category with highest a-posteriori probability, calculated as above, using Bayes Rule.
then,1 • Decision boundary: • or in general, decision boundaries are where: • between regions and
Single feature – decision boundary – point • 2 features – curve • 3 features – surface • More than 3 – hypersurface • Sometimes, it is easier to work with logarithms • Since logarithmic function is a monotonically increasing function, logfnwill give the same result.
2 Category Case: Assign to if if But this is the same as: if By throwing away ‘s, we end up with: if Which the same as: Likelihood ratio
Example:asingle feature, 2 category problem with gaussian density • : Diagnosis of diabetes using sugar count X • state of being healthy • state of being sick (diabetes) • The decision rule: • ifor
Assume now: • And we measured: • Assign the unknown sample: to the correct category. • Find likelihood ratio: for • Compare with: • So assign: to .
Example: A discrete problem • Consider a 2-feature, 3 category case • where: • And , , • Find the decision boundaries and regions: • Solution:
Remember now that for the 2-class case: • if • or • Likelihood ratio • Error probabilities and a simple proof of minimum error • Consider again a 2-class 1-d problem: • Let’s show that:if the decision boundary is (intersection point) • rather than any arbitrary point .
Then (probability of error) is minimum. • It can very easily be seen that the is minimum if .
Minimum Risk Classification Risk associated with incorrect decision might be more important than the probability of error. So our decision criterion might be modified to minimize the average risk in making an incorrect decision. We define a conditional risk (expected loss) for decision when occurs as: Where is defined as the conditional loss associated with decision when the true class is . It is assumed that is known. The decision rule: decide on if for all The discriminant function here can be defined as: 4
We can show that minimum – error decision is a special case of above rule where: • then, • so the rule is if
For the 2 – category case, minimum – risk classifier becomes: • if • if • Otherwise, . • This is the same as likelihood rule if • and
Discriminant Functions so far For Minimum Error: For Minimum Risk: Where
Bayes (MaximumLikelihood)Decision: • Most general optimal solution • Provides an upper limit(you cannot do better with other rule) • Useful in comparing with other classifiers
Special Cases of Discriminant Functions Multivariate Gaussian (Normal) Density : The general density form: Here in the feature vector of size . M:d element mean vector : covariance matrix (variance of feature ) - symmetric when and are statistically independent.
- determinant of • General shape:Hyper ellipsoids where • is constant: • Mahalanobis Distance • 2 – d problem: , • If , • (statistically independent features) then, • majoraxes are parallel to major ellipsoid axes
if in addition • circular • in general, the equal density curves are hyper ellipsoids.Now • is usedfor since itsease in manipulation • is a quadratic function of as will be shown.
a scalar Then, On the decision boundary,
Decision boundary function is hyperquadratic in general. Example in 2d. Then, above boundary becomes
General form of hyper quadratic boundary IN 2-d. The special cases of Gaussian: Assume Where is the unit matrix
(not a function of X so can be removed) Nowassume euclidiandistancebetween X and Mi Then,the decision boundary is linear !
Decision Rule: Assign the unknown sample to the closest mean’s category unknown sample d= Perpendicular bisector that will move towards the less probable category
Minimum Distance Classifier • Classify an unknown sample X to the category with closest mean ! • Optimum when gaussian densities with equal variance and equal a-priori probability. Piecewiselinearboundary in case of morethan 2 categories.
Another special case:It can be shown that when(Covariance matrices are the same) • Samples fall in clusters of equal size and shape unknown sample is calledMahalonobisDistance is called Mahalonobis Distance
Then, if The decision rule: if (Mahalanobis Distance of unknown sample to ) > (Mahalanobis Distance of unknown sample to ) If The boundary moves toward the less probable one.
Binary Random Variables • Discrete features: Features can take only discrete values. Integrals are replaced by summations. • Binary Features: 0 or 1 • Assume binary features are statistically independent. • Where is binary
Binary Random Variables Example: Bit – matrix for machine – printed characters a pixel Here, each pixel may be taken as a feature For above problem, we have is the probability that for letter A,B,… B A
defined for undefined elsewhere: • Ifstatisticalindependence of features is assumed. • Consider the 2 category problem; assume:
then, the decision boundary is: So if The decision boundary is linear in X. a weighted sum of the inputs where: and