Download
1 / 14
330 likes | 781 Views
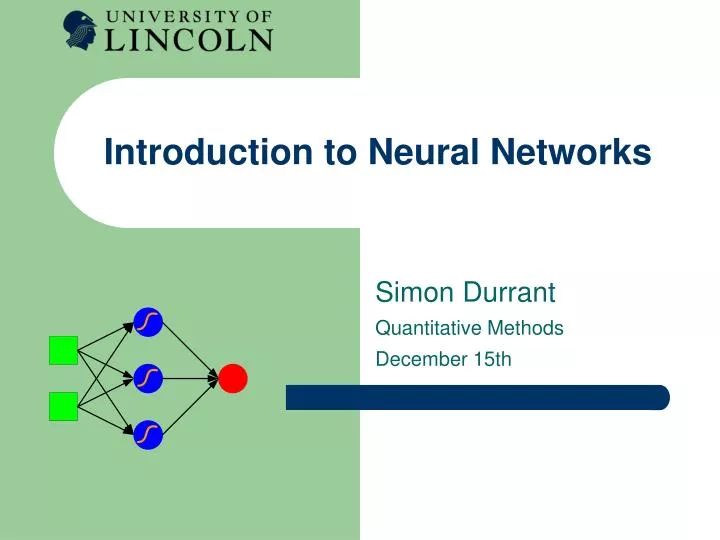
Introduction to Neural Networks. Simon Durrant Quantitative Methods December 15th. A Typical Artificial Neural Network. A neural network consists of neurons connected by weights . Inputs get multiplied by the weights and summed before entering neurons.

E N D
Introduction to Neural Networks Simon Durrant Quantitative Methods December 15th
A Typical Artificial Neural Network • A neural network consists of neurons connected by weights. • Inputs get multiplied by the weights and summed before entering neurons. • Neurons have transfer functions which change the signals and then give outputs. • Neurons may also have a threshold or bias input (not shown). But what are they for?
The Family of Neural Networks • Many types of network; some common subdivisions. • Supervised learning: • we have a set of exemplars for which we have known target outputs. • The network learns by adjusting weights to better achieve the target outputs. • Unsupervised learning: • We aim to find groups and subdivisions within our data • Weights are adjusted such that neurons with similar weight patterns are made even more similar, while others are made more distinct. Each set of similar neurons comes to represent a particular subgroup in the data, and responds most strongly to inputs from the subgroup.
Classification with ANNs • Two classes (red and blue), two-dimensional data (i.e. each data point is defined by two values, such as length and width). • We want a model that can separate the two classes, and will be able to tell us which class a new data point belongs to. • http://lcn.epfl.ch/tutorial/english/mlp/html/index.html
Classification with ANNs • Two classes (red and blue), two-dimensional data (i.e. each data point is defined by two values, such as length and width). • We want a model that can separate the two classes, and will be able to tell us which class a new data point belongs to. • http://lcn.epfl.ch/tutorial/english/mlp/html/index.html
Regression with ANNs • We want to predict Boston house prices. We have measured 13 different variables associated with 500+ houses in Boston for which we know the price. • We want a model that will use the relevant information from our inputs in whatever complex combination gives the best outcome. • We will use the Matlab Neural Network Toolbox for this demo. • Our chosen network is a multi-layer perceptron.
Regression with ANNs • Our network has learned to predict the correct price for houses that it was not trained on (the test set) – it has generalised. • The strong performance (r ranges between 0 and 1, where 1 is a perfect score; we have r=0.948 for the unseen test data) is greater than the maximum that can be achieved with multiple linear regression.
Cluster Visualisation with ANNs • We have taken four different measurements from different types of iris flowers: sepal length, sepal width, petal length, petal width. • We want to know if there are subgroups of irises. • A Self-Organising Map is the type of neural network we use here. • It adjusts weights to group similar items using a Mexican hat. • We will use the Matlab Neural Network Toolbox for this demo.
Cluster Visualisation with ANNs • Weights have evolved to cover the input space. • Looking at weight distances in the grid, we see clear subdivisions within the data. • This is reflected in the number of hits for neighborouging neurons.
Cluster Visualisation with ANNs • Another demo (from http://www.ai-junkie.com/ann/som/som5.html): self-organisation of small coloured blocks on the basis of their RGB colour values. • It can be used for practical purposes in mapping world poverty, for example, when measured by a complex series of variables (e.g. health, nutrition, education, water supply etc.) • All of these are forms of dimensionality reduction – take complex multivariate data and reduce it to two (or N) dimensions.
Advantages of Neural Networks • Can handle many different statistical requirements (regression, classification, clustering, time series analysis, pattern analysis etc.). • Can handle nonlinear data without any special measures. • Are somewhat model-free, i.e. you do not need to know in advance whether to use a linear model, polynomial model etc.. • Seamlessly provide generalisation, i.e. can be applied to novel inputs and give a useful and meaningful output. • Provide graceful degradation; if you break part of the model, it does not fall apart entirely.
…and Disadvantages • Can be something of a black box. • Requires selection of particularly type of network. • Requires choice of network architectural features (such as the number of neurons within a layer). • Setting free parameter values in order to achieve good performance can sometimes be difficult. But if treated with care, artificial neural networks can offer a set of very powerful statistical techniques without requiring a large knowledge of statistics.
Applications of Neural Networks • Sales forecasting. • Industrial control systems. • Robot navigation. • Stock price prediction. • Medical image analysis. • Musical instrument classification. • Modelling human cognition. • Consumer behaviour data mining. • …and 100s more.
Thanks for Listening! Any Questions?