Download
1 / 17
170 likes | 593 Views
A Reanalysis of Hurricane Hazel (1954). Scott Weese, Ron McTaggart-Cowan and John R. Gyakum Department of Atmospheric and Oceanic Sciences McGill University Montreal, Quebec, Canada June 4th, 2003. Talk Outline. . Background . Synoptic Overview . MC2 Simulation Results . Conclusions.

E N D
A Reanalysis of Hurricane Hazel (1954) Scott Weese, Ron McTaggart-Cowan and John R. Gyakum Department of Atmospheric and Oceanic Sciences McGill University Montreal, Quebec, Canada June 4th, 2003
Talk Outline • . Background • . Synoptic Overview • . MC2 Simulation Results • . Conclusions
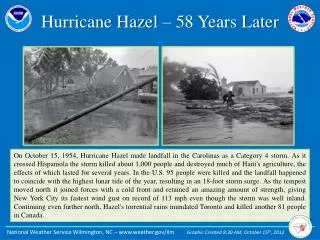
Purpose: to study the thermodynamic and dynamic properties of one of the most deadly and costly weather disasters to strike southern Ontario • Hazel struck Ontario on 15-16 October 1954 • rains led to flooding in Humber, Credit and Don River valleys situated near Toronto, and in the Holland Marsh north of Toronto • over 80 fatalities, and $175 million damage was done by Hurricane Hazel in Ontario
Track of Hurricane Hazel Reference: Mason, A.H., M.K. Thomas and D.W. Boyd. 1955. The October 15-16, 1954 Storm, “Hurricane Hazel” in Ontario.
Synoptic Overview • Considering the time between October 15th at 00z to October 16th at 12z as this is the period of the most intense rainfall in southern Ontario • Using the NCEP reanalysis data (Kalnay et al. 1996) to generate fields of interest
Figs. (a)-(d): SLP (hPa) and Thickness (dam)00 UTC 15 to 12 UTC 16 October
Dynamic Tropopause Maps • The dynamic tropopause is defined as the 1.5 PVU surface • 1 PVU = 10-6m2s-1K kg-1 • Ertel’s Potential Vorticity (PV) (Ertel 1942):
Figs. (a)-(d): DT Winds and q, and 850 hPa q00 UTC 15 to 12 UTC 16 October
Coupling Index, Equivalent Potential Temperature and Precipitable Water • Coupling Index (CI) is a measure of bulk atmospheric stability (Bosart and Lackmann 1995) • Values of CI < 10 suggest convective instability • Precipitable water is the column integrated water vapour
Figs. (a)-(d): Coupling Index and Precip. Water (mm)00 UTC 15 October to 12 UTC 16 October
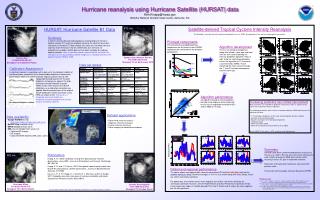
MC2 Simulation • Using MC2 (Mesoscale Compressible Community Model) to simulate Hazel • NCEP Reanalysis data utilized for the initial and boundary conditions • following the work of Palmen (1958) and Anthes (1990) • test sensitivity of Hazel to improved vortex structure using model by Kurihara (1993), and increased spatial resolution (36 km)
SLP Comparison 15 UTC 15October top: Palmen’s analysis lower left: MC2 lower right: Anthes
SLP Comparison3 UTC 16October top: Palmen’s analysis lower left: MC2 lower right: Anthes
Knox’s Jump SLP for 21 UTC 15 October to 03 UTC 16 October
Conclusions • Successfully reproduced transformation of Hazel with accompanying frontogenesis and heavy precipitation over U.S. • Improved vortex structure and increased spatial resolution necessary for successful mesoscale modeling of Hazel