Download
1 / 10
100 likes | 176 Views
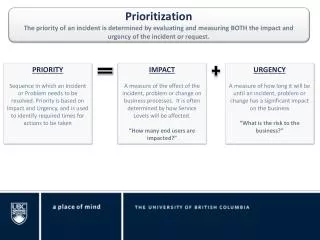
VP Product Prioritization. 6 Jan 2010 Executive Committee. Process Recap. VP Product Reviews (June and July 2009): Drilled into VP Net Margin, showing financials for individual products on a total cost basis. Revenue sources/direct expenses category breakdowns were provided.

E N D
VP Product Prioritization 6 Jan 2010 Executive Committee
Process Recap • VP Product Reviews (June and July 2009): • Drilled into VP Net Margin, showing financials for individual products on a total cost basis. • Revenue sources/direct expenses category breakdowns were provided. • Institute Product Review (August 2009): • Review products and their relationship to each other within the context of the whole Institute to provide VPs with a “total financial picture”. • VP Presentations (September-November 2009): • Outline major program areas for each VP and their priorities
Our Challenge • How do we absorb $1M in Operations in FY11? • Absorbed all IT costs in FY10 • Costs of doing business are increasing • No significant new business on immediate horizon • Existing products are not growing • What is the right mix of products and services to keep our business financials in balance and our members happy? • Where will we find sustainable growth? • Expense management is not a growth strategy. • Relying on vended and one time events is a risky operational plan. • Acquisition of small conferences can’t bring sustainable growth. • Can we leverage our infrastructure and expertise through strategic acquisitions/mergers?
Our Goal for Today • To develop an integrated list of product priorities, spanning all VP areas, which: • Supports AIAA’s overall mission and objectives • Can be sustained through AIAA’s operational budget • Eliminates the need for support from the Institute’s investment portfolio • Serves as a roadmap for creating the FY11 budget
Product Priority by VP: Financial Performance Key • Using the VP presentations, create a list of priorities within each VP • Classify financial performance of products: • Green: Margin greater than $50K • Yellow: Margin between -$50K and $50K • Red: Margin below -$50K • Margin defined as Revenue less Direct Costs less Salary/Benefits (no indirect allocations applied) • FY10 Strategic Plan items (indicated with “*”) have been included within Public Policy and Communications activities, consistent with VP presentations • Financials based on FY09 actual results and FY10 Strategic Plan budget
FY09: Product Margin (ex allocations) Member Services Public Policy Educ TAC Pubs Stds Intl Outreach • Product Margin = Revenue less Direct Expenses less Salary/Tax/Benefits.
Product Net Margin (with Allocations) Member Services Educ TAC Pubs Stds Intl Public Policy Outreach • Net Margin = Revenue less Direct Expenses less Salary/Tax/Benefits less Allocations.