Download
1 / 38
380 likes | 522 Views
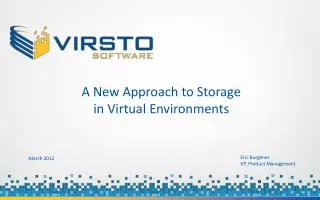
Alternative Approaches to Meeting VDI Storage Performance Req’ts. July 2012. Eric Burgener VP, Product Management. Agenda. The storage challenge in VDI environments Profiling VDI workloads Focus on SSD An alternative approach: the storage hypervisor Customer case studies.

E N D
Alternative Approaches to Meeting VDI Storage Performance Req’ts July 2012 Eric Burgener VP, Product Management
Agenda • The storage challenge in VDI environments • Profiling VDI workloads • Focus on SSD • An alternative approach: the storage hypervisor • Customer case studies July 2012
Hidden Storage Costs of Virtualization • ❶Poor performance • Very random, write-intensive workload • Spinning disks generate fewer IOPS • Storage provisioning trade-offs • ❷ Poor capacity utilization • Over-provisioning to ensure performance • Performance trade-offs VM VM VM VM • ❸ Complex management • Requires storage expertise • Imposes SLA limitations • Limits granularity of storage operations Virtual Machines The VM I/O Blender July 2012
Hidden Storage Costs of Virtualization • ❶Poor performance • Very random, write-intensive workload • Spinning disks generate fewer IOPS • Storage provisioning trade-offs • ❷ Poor capacity utilization • Over-provisioning to ensure performance • Performance trade-offs VM VM VM VM Can decrease storage performance by 30% - 50% • ❸ Complex management • Requires storage expertise • Imposes SLA limitations • Limits granularity of storage operations Virtual Machines The VM I/O Blender July 2012
VDI Environments Are Even Worse • Windows desktops generate a lot of small block writes • IOPS vs throughput needs • Even more write-intensive due to many more VMs/host • Much wider variability be-tween peak and average IOPS • Boot, login, application, logout storms • Add’l storage provisioning, capacity consumption issues VIRTUAL DESKTOPS July 2012
As If It’s Not Already Hard Enough… HIGH PERFORMANCE Slow provisioning Poor space utilization SPACE-EFFICIENT RAPID PROVISIONING Poor performance RAPID PROVISIONING SPACE-EFFICIENT Poor performance Thick VMDKs Fixed VHDs Fully provisioned Thin VMDKs Dynamic VHDs Thin provisioned Linked Clones Differencing VHDs Writable clones Hypervisor storage options force suboptimal choices July 2012
Thick, Thin, and Snapshot Performance July 2012
Sizing VDI Storage Configurations: The Basics Steady state I/O Peak I/O Read/write ratios Sequential vs random I/O PERFORMANCE (latency, IOPS) 2. AVAILABILITY (RAID) RAID reduces usable capacity RAID increases “actual” IOPS Appropriate RAID levels Logical virtual disk capacities Snapshot/clone creation/usage Secondary storage considerations Capacity optimization technology 3. CAPACITY July 2012
Single Image Management • How can we take advantage of many common images? • vSphere: parent VMs, snapshots, replicas, linked clones Linked Clones • Reads from replica • Changes to delta disks • Space efficient • Poor performance Parent VM Snapshot Replica … • Compose, re-compose and refresh workflows July 2012
Reads vs Writes in VDI Environments VDI is VERY write intensive (80%+) Read caches do not help here Logs or write back cache help Understand read/write ratios for steady state and burst scenarios READ INTENSIVE: Boot, login, and application storms, AV scans WRITE INTENSIVE: Steady state VDI IOPS, logout storms, backups* GOLDEN MASTERS: Read only, great place to use “fast” storage Steady state XP Desktops 7 – 15 IOPS Steady state W7 Desktops 15 – 30 IOPS Burst IOPS 30 – 300 IOPS VMware recommendations, May 2012 * Depending on how backups are done July 2012
What Are My Options? SOLID STATE DISK BUY MORE STORAGE BUY FASTER STORAGE • Add to host or SAN • Promises tremendously lower I/O latencies • Easy to add • Focus on $/IOPS • Adding spindles adds IOPS • Tends to waste storage capacity • Drives up energy, backup costs • Add higher performance drives (if available) • Upgrade to a higher performance array • Increased storage complexity July 2012
Focus On SSD • Extremely high read performance with very low power consumption • Generally deployed as a cache where you’ll need 5% - 10% of total back end capacity • Deploy in host or in SAN • Deployment option may limit HA support • 3 classes of SSD: SLC, enterprise MLC, MLC • SSD is expensive ($60-$65/GB) so you’ll want to deploy it efficiently July 2012
Understanding SSD Performance 100% read max IOPS 115,000 100% write max IOPS 70,000 100% random read max IOPS 50,000 100% random write max IOPS 32,000 July 2012
What They Don’t Tell You About SSD • The VDI storage performance problem is mostly about writes • SSD is mostly about read performance • But there are VDI issues where read performance helps • Write performance is not predictable • Can be MUCH slower than HDDs for certain I/Os • Amdahl’s Law problem: SSDs won’t deliver promised performance, it just removes storage as the bottleneck • Using SSD efficiently is mostly about the software it’s packaged with • Sizing is performance, availability AND capacity July 2012
Good Places To Use SSD • Cache • In host: lowest latencies but doesn’t support failover • In SAN: still good performance and CAN support failover • Golden masters • Where high read performance is needed for various “storms” • Tier 0 • To primarily boost read performance • If you don’t use SSD as a cache • Keep write performance trade-offs in mind when deploying SSD July 2012
The Storage Hypervisor Concept … STORAGE HYPERVISOR SERVER HYPERVISOR • Server hypervisors increase server resource utilization and virtualize server resources • Increases resource utilization and improves flexibility • Storage hypervisors increase storage utilization and virtualize storage resources • Increases storage utilization and improves flexibility Performance, capacity and management implications July 2012
Introduction of a Dedicated Write Log Per Host • Log turns random writes into a sequential stream • Storage devices can perform up to 10x faster • De-staging allows data to be laid out for optimum read performance • Minimizes fragmentation issues • Requires no add’l hardware to achieve large performance gains • The more write intensive, the better the speed up • Excellent recovery model for shared storage environments … HOST HYPERVISOR Optimized Writes Acknowledgements Optimized Reads Dedicated write log Optimized asynchronous de-staging Tier 1 Tier n Tiered Storage July 2012
Log De-Couples High Latency Storage Operations THESE OPERATIONS NO LONGER IMPACT VM PERFORMANCE … HOSTS THIN PROVISIONING HYPERVISOR Write Logs ZERO IMPACT SNAPSHOTS Storage Pool HI PERFORMANCE CLONES Shared Storage INSTANT PROVISIONING July 2012
The Virsto Storage Hypervisor Fundamentally changes the way hypervisors handle storage I/O Improves performance of existing storage by up to 10x Thin provisions ALL storage with NO performance degradation Reduces storage capacity consumption by up to 90% Enables almost instant provision- ing of high performance storage Reduces storage provisioning times by up to 99% Allows VM-centric storage manage- ment on top of block-based storage Enables safe provisioning and de- provisioning of VMs by anyone July 2012
Virsto Architecture Server Host • Integrates log architecture transparently into hypervisor • Speeds ALL writes ALL the time • Read performance speedups • Storage tiering, optimized layouts • Instant provisioning of space-efficient, high performance storage • Scalable snapshots open up significant new use cases • Software only solution that requires NO new hardware Virsto VSA Hypervisor Sequential I/O Virsto vLog Optimized de-staging Virsto vSpace Slow, random I/O Block Storage Capacity (RAID) Primary Storage July 2012
Multi Node Architecture For Scalability Host N Host 2 Host 1 Virsto VSA Virsto VSA Virsto VSA … Hypervisor Hypervisor Hypervisor Sequential I/O Sequential I/O Sequential I/O Virsto vLog Virsto vLog Virsto vLog Virsto vSpace Block Storage Capacity (RAID) Block Storage Capacity (RAID) Multiple Different Arrays July 2012
Integrated Virsto Management • Install and configure through Virsto Console • Provision Virsto ONCE up front • Uses standard native workflows • vSphere, Hyper-V • Transparently uses Virsto storage • Higher performance, faster provisioning, lower capacity consumption, cluster-aware • Works with native tools so minimal training July 2012
Virsto And SSD • Virsto achieves 10x performance speedups WITHOUT SSD and with what you already own • But Virsto logs and storage tier 0 are great places to use SSD • Easily uses 50% less SSD than caching approaches to get comparable speedups • Logs are only 10GB in size per host • We make random writes perform 2x+ faster on most SSD • Very small tier 0 to get read performance (for golden masters, certain VMs) • If you want to use SSD, you spend a lot less money to implement it July 2012
Proof Point: Higher Education Baseline Environment Performance with Virsto 10X more IOPS 24% lower latency 9x CPU cycle reduction 341 IOPS Native VMDKs 3318 IOPS Virsto vDisks Virsto for vSphere December 2011 Results July 2012
Proof Point: State Government 2926 IOPS Virsto vDisk 165 IOPS Native VMDKs 18X more IOPS 1758% better throughput 94% lower response time July 2012
Proof Point: Desktop Density With Virsto, each host supports over 2x times the number of VDI sessions, assuming the same storage configuration 830 401 2000 July 2012
Case Study 1: Manufacturing REQUIREMENTS • Would like to maximize desktop density to minimize host count • Target is 125-150 desktops/host • Will be using vSphere 5.1 • Spindle minimization could accommodate other projects • Open to using SSD in VNX • 400GB EFDs • Asked about phasing to minimize peak load requirements • Asked about VFcache usage • 1200 Windows 7 desktops • Common profile • Steady state: 12 IOPS • Read/write ratio: 10/90 • Peak load: 30 IOPS • 25GB allocated/desktop • Need vMotion support now • HA as a possible future • Windows updates 4/year • Already own an EMC VNX • 40U enclosure w/4 trays • 10K rpm 900GB SAS • 100 drives = 90TB July 2012
Comparing Options Without SSD July 2012
Virsto Single Image Management vSnap of golden master vClones • With EZT VMDKs, native consumption was 25GB x 1000 = 25TB • With thin VMDKs, native consumption would be 25GB + (14GBx1000) = 14TB • And would require 5x as many spindles for IOPS • Not workable, too many drives/arrays, etc. • With View Composer linked clones, space consumption would be the same as Virsto but you’d need 5x the spindle count • Virsto provides better than EZT VMDK performance with space savings of linked clones vClone 0 Stabilizes at 2GB* 25GB logical 12GB (Windows) vClone 1 Stabilizes at 2GB* vClone 2 Stabilizes at 2GB* … vClone 999 Stabilizes at 2GB* 12GB + 2TB = 2TB Actual Space Consumed for Virsto * Based on 8 different LoginVSI runs with 1000-2000 desktops July 2012
Virsto Single Image Management vSnap of golden master vClones • With EZT VMDKs, native consumption was 25GB x 1000 = 25TB • With thin VMDKs, native consumption would be 25GB + (14GBx1000) = 14TB • And would require 5x as many spindles for IOPS • Not workable, too many drives/arrays, etc. • With View Composer linked clones, space consumption would be the same as Virsto but you’d need 5x the spindle count • Virsto provides better than EZT VMDK performance with space savings of linked clones vClone 0 Stabilizes at 2GB* 25GB logical 12GB (Windows) vClone 1 Stabilizes at 2GB* vClone 2 Stabilizes at 2GB* … Virsto 92% better than thick VMDKs Virsto 86% better even than thin VMDKs vClone 999 Stabilizes at 2GB* 12GB + 2TB = 2TB Actual Space Consumed for Virsto * Based on 8 different LoginVSI runs with 1000-2000 desktops July 2012
Assumptions • EMC VNX SSD performance • 12K read IOPS, 3K write IOPS per SSD • With 2 SPs, can max out a tray w/o limiting performance • VM creation time depends on busy-ness of vCenter Server • Observed 30 sec - 1 min baseline across both Virsto and non-Virsto configs • 5 min VM+storage creation time w/o Virsto, 1 min w/Virsto • Customer had chosen thick VMDKs for performance/spindle minimization • Provisioning comparisons were EZT VMDKs against Virsto vDisks (which outperform EZTs handily) • Customer RAID 5 overhead was 17% • (5 + 1) RAID • Pricing for EMC VNX 5300 • 200GB EFD $12,950 • 900GB SAS 10K RPM $1,750 July 2012
Case Study 1: Other Observations • Virsto vClones do not have the 8 host limit • View Composer linked clones in VMFS datastores limited to 8 hosts • Performance + capacity considerations limit applicability of SSD to this environment • Using RAID 5, minimum capacity required is 33.9TB • Customer could not have met storage requirement with VNX 5300 • Would have to upgrade to VNX 5700 or buy extra cabinets • Thin provisioned Virsto vDisks provide significant capacity cushion • Virsto vClones expected to save 66 hours provisioning time for high performance storage on each re-compose • That’s up to 256 hours per year clock time for provisioning (4 Windows updates) July 2012
Case Study 2: Financial Services REQUIREMENTS • Would like to maximize desktop density to minimize host count • Target is 125-150 desktops/host • Will be using vSphere 5.1 • Spindle minimization could accommodate other projects • Wants to use a SAN and open to using SSDs • Asked about phasing to minimize peak load requirements • 1000 Windows 7 desktops • Common profile • Steady state: 20 IOPS • Read/write ratio: 10/90 • Peak load: 60 IOPS • 30GB allocated/desktop • Need vMotion support now • HA as a possible future • Windows updates 6/year • Would be buying new SAN storage July 2012
Comparing Options July 2012
Assumptions • IBM DS5000 SSD performance • 12K read IOPS, 3K write IOPS per SSD • With 2 SPs, can max out a tray w/o limiting performance • VM creation time depends on business of vCenter Server • Observed 30 sec - 1 min baseline across both Virsto and non-Virsto configs • 6 min VM+storage creation time w/o Virsto, 1 min w/Virsto • Customer had chosen thick VMDKs for performance/spindle minimization • Provisioning comparisons were EZT VMDKs against Virsto vDisks (which outperform EZTs handily) • Customer RAID 5 overhead was 17% • (5+1) RAID • Pricing for IBM DS5000 • 200GB EFD $12,950 • 600GB SAS 10K RPM $1,500, DS5000 frame $40K July 2012
Case Study 2: Other Observations • Virsto makes SSD perform twice as fast • Makes all writes sequential • Need 50% less SSD • 10GB log in RAID 1 across 8 hosts = 160GB for logs, leaves 1.4TB available for Fast Cache/tier 0 use • Virsto cuts required raw storage capacity by 78% • And can accommodate an additional 300+ desktops w/o more storage hardware purchases • Space savings conservative at only 70% • Generally we see 80% - 90% space savings over the long term • Virsto vClones expected to save 83 hours provisioning time for high performance storage on each re-compose • That’s 498 hours per year across 6 Windows updates July 2012
Demonstrated Customer Value July 2012