Download
1 / 42
420 likes | 612 Views
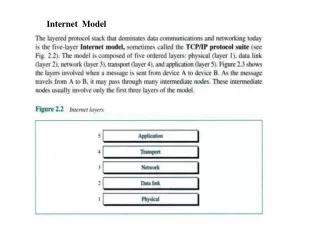
On Internet Traffic Dynamics and Internet Topology II Internet Model Validation. Walter Willinger AT&T Labs-Research walter@research.att.com. Topics Covered. Self-similar network traffic Mandelbrot’s legacy Self-similarity through high variability A new model validation framework

E N D
On Internet Traffic Dynamics and Internet Topology IIInternet Model Validation Walter Willinger AT&T Labs-Research walter@research.att.com
Topics Covered • Self-similar network traffic • Mandelbrot’s legacy • Self-similarity through high variability • A new model validation framework • Illustrations of validation framework • Self-similar traffic vs. Poisson • Chaos and self-similarity • SOC and the Internet • The “New Science of Networks” and the Internet • Lessons learned
Time scale: 100 sec Time scale: 100 sec Time scale factor: 10 at each step Time scale factor: 10 at each step 10 msec 10 msec
Time scale: 100 sec Time scale: 100 sec Varibility scales like 10^(-0.8) at each step Variability scales like 10^(-0.5) at each step 10 msec 10 msec
Mandelbrot’s Construction • Renewal reward processes and their aggregates • Aggregate is made up of many constituents • Each constituent is of the on/off type • On/off periods have a “duration” • Constituents make contributions (“rewards”) when “on” • Constituents make no contributions when “off” • What can be said about the aggregate? • In terms of assumed type of “randomness” for durations and rewards • In terms of implied type of “burstiness”
A Closely Related Construction • Cox’s construction • Aggregate traffic is made up of many connections • Connections arrive at random • Each connection has a “size” (number of packets) • Each connection transmits packets at some “rate” • The limiting regimes for the aggregate are essentially the same as those for Mandelbrot’s construction • Also called immigration-death or M/G/ process
Mandelbrot’s Types of “Randomness” • Distribution functions/random variables • “Mild” → finite variance (Gaussian) • “Wild” → infinite variance (heavy tails) • Correlation function of stochastic process • “Mild” → short-range dependence (SRD, Markovian) • “Wild” → long-range dependence (LRD)
Mandelbrot’s Types of “Burstiness” Distribution function Mild Wild SRD LRD Correlation structure • Tail-driven burstiness (“Noah effect”) • Dependence-driven burstiness (“Joseph effect”)
Log-linear scales Type of Burstiness: “Smooth” CCDF Function 1-F(x) 1-F(x) on log scale x on linear scale Correlation Function r(n) r(n) on log scale lag n on linear scale
Log-linear scale Log-log scale Type of Burstiness: “bursty” CCDF Function 1-F(x) 1-F(x) on log scale x on linear scale Correlation Function r(n) r(n) on log scale lag n on log scale
Log-log scale Log-linear scale Type of Burstiness: “Bursty” CCDF Function 1-F(x) 1-F(x) on log scale x on log scale Correlation Function r(n) ? r(n) on log scale lag n on linear scale
Log-log scales Type of Burstiness: “BURSTY” CCDF Function 1-F(x) ? 1-F(x) on log scale x on log scale Correlation Function r(n) ? r(n) on log scale lag n on log scale
Mathematical Framework • Mathematical abstraction • Ignores most transport-specific features • Assumes unlimited link bandwidth • Consider (normalized) double-limit process • Large M (many users), large T (coarse time scale) • Large M limit, then large T limit: “TCP-type” behavior • Large T limit, then large M limit: “UDP-type” behavior • with the aggregated total workload from 0 to u
Mathematical Result (1) • Assumed “randomness” • Durations are heavy-tailed with infinite variance • Rewards are 0/1 • Large M-limit, then large T-limit (TCP-like transport) • “Mild” marginals (Gaussian) • “Wild” correlations (LRD) • Limit process • Fractional Brownian motion • Aggregate of many long, thin flows
Let’s look at Internet traffic over some link application traffic is streamed out on the net Web client creating Internet traffic Web servers
Internet traffic Link
Web traffic … X = “wild” HTTP Requests/responses time … is streamed onto the Internet … … creating “bursty-looking” link traffic (TCP-type transport) Y = “colored” noise
Mathematical Result (2) • Assumed “randomness” • Durations are heavy-tailed with infinite variance • Rewards are 0/1 • Large T-limit, then large M-limit (UDP-like transport) • “Wild” marginals (stable) • “Mild” correlations (independence) • Limit process • Levy stable motion • Aggregate of many short, fat flows
Web traffic … X = “wild” HTTP requests/responses time … creating “bursty-looking” link traffic … is streamed onto the Internet … Y = “stable” noise (UDP-type transport)
A New Model Validation Approach • Traditional framework for model validation • Model “fits” or “describes” the data “well” • “Well” according to a goodness-of-fit criterion • Model results in comparable performance • Need for a paradigm shift • New mathematical constructions ensure good “fit” • Standard goodness-of-fit criteria perform poorly with “voluminous” or “unusual” data (LRD, heavy tails) • Performance may be comparable, but wrong (e.g., due to neglecting crucial feedback regulation)
The “Closing the Loop” Approach • Discovery (data-driven) • Proposed explanation in terms of elementary concepts or mechanisms (mathematics) • Step 2 suggests first-of-its-kind measurements or revisiting existing measurements related to checking the elementary concepts or mechanisms • Empirical validation of elementary concepts or mechanisms using the data collected in Step 3
Why “Closing the Loop” is Progress • Departure from classical “data-fitting” • Validation is moved to a more elementary or fundamental level • Fully exploits the context in which measurements are made (“start with data, end with data”) • If successful, provides actual explanation of “emergent” phenomena (new insight) • Shows inherent limitations and weaknesses of proposed model, suggests further improvements
Illustration of the “Closing the Loop” Approach • Self-similarity through high variability • Self-similar traffic vs. Poisson • Chaos and self-similarity • Self-organized criticality (SOC) and the Internet • The “New Science of Networks” and the Internet
Example 0: Self-Similarity – High Variability • Discovery: Self-similar nature of aggregate traffic on a link • Mathematics: Mandelbrot/Cox construction • Suggested new measurements • Session/flow/connection sizes • Analysis of new measurements • Check session/flow/connection size distributions
Example 1:Poisson vs. Self-Similar • Lucent Press Release, June 6, 2001http://www.lucent.com/press/0601/010606.bla.htlm • Cao, Cleveland, Lin, and Sun, ”Internet traffic tends toward Poisson and Independent as the Load Increases” (2002)
Claims and Supporting Evidence • Claims • Internet traffic tends to Poisson and independent as the load increases • Packet interarrival times (of aggregate traffic) become exponentially distributed and independent as the link load increases • Supporting evidence • 2526 packet traces, 5 min or 90 sec in duration • Impressive-looking statistical analysis of traces
Bottom-line • Specious claims based on impressive-looking, but specious analysis of the data • Specious nature of the claims are revealed by a straightforward application of the “closing the loop” concept • Reminder (J.W. Tukey, 1975) “Often the purpose of good analysis is not so much to do well in catching what you want but rather to well … in rejecting what you don’t want.”
Example 2:Chaos and Self-Similarity • Infocom 2000, Best Paper Award • http://www.ieeeinfocom.org/2000/papers/74.pdf • Veres and Boda,”The chaotic nature of TCP congestion control” (2000)
Claims and Supporting Evidence • Claims • TCP itself, as a deterministic process, creates chaos, which generates self-similarity • Approach taken • Simulation study based on ns • Chaos theory-inspired analysis of simulated trace data (phase plots, attractors, Lyapunov exponent) • Ad-hoc testing of self-similarity
Bottom-line • Specious claim as a result of a specious experiment/simulation/analysis • Considerable, not-so-solid follow-up work • ns can generate pseudo-chaotic observations • Reminder (Floyd and Paxson, 2001) “Network simulators make it easier for researchers to create simulations, but the researchers themselves remain responsible for making their use of simulation relevant and insightful, rather than irrelevant or misleading.”
Example 3: Self-Organized Criticality (SOC) and the Internet • Csabi, “1/f noise in computer network traffic” (1994) • Ohira and Sawatari, “Phase transition in computer traffic models” (1998) • Yuan, Ren, and Shan, “Self-organized criticality in a computer network model” (2000) • Sole and Valverde, “Information transfer and phase transitions in a model of Internet traffic” (2001)
Claims and Supporting Evidence • (Selected) Claims • Self-similar traffic traffic is the result of a phase transition • There exist deep links between Internet traffic and highway traffic • Approach • Simulation-based studies (cellular automata) • Ignores Internet-specific “details” for the sake of addressing “fundamental” issues
Bottom-line • Specious claims as a result of a specious model • Specious nature of the claims is revealed by a trivial “closing the loop” argument • Building a network with the claimed properties seems feasible but is not recommended! • Reminder (Floyd and Paxson, 2001) “Simulation carries with it the risk of using a model simplified to the point where key facets of Internet behavior have been lost, in which case any ensuing results could be useless (though they may not appear to be so.”
Example 4: The “New Science of Networks” and the Internet • Nature, July 2000, “Achilles’ heel of the Internet’’ • Albert, Jeong, and Barabasi, “Error and attack tolerance of complex networks” (2000) • A.-L. Barabsi, “Linked: The New Science of Networks” (2002)
Claims and Supporting Evidence • (Selected) Claims • The Internet topology is “scale-free” • The Internet topology is robust to random attack, but highly vulnerable to targeted attacks (“Achilles’ heel”) • Approach taken • Develop new class of “scale-free” graphs • Model Internet topology as “scale-free” graph • Simulation studies with “scale-free” graphs
Bottom-line • Specious claims as a result of specious models for Internet connectivity • Shows the power of the “closing the loop” concept • Building an Internet with “scale-free” properties may be possible, but is not recommended! • The “New Science of Networks” has little networking relevance (so far!)
Lesson Learned • Expect specious claims and theories about the Internet [“specious” – having deceptive attraction or allure, or having a false look of truth or genuiness] • Press releases (URL’s), accepted INFOCOM papers (even if they get the Best Paper Award), published articles in Nature or Science (especially on Internet-related topics), etc. can be wrong!