Download
1 / 9
90 likes | 104 Views
Visualizing Internet Topology Dynamics with Cyclops. Ricardo Oliveira,Ying-Ju Chi, Ioannis Pefkianakis, Mohit Lad, Lixia Zhang University of California, Los Angeles. Speaker: Ricardo Oliveira rveloso@cs.ucla.edu. Why Visualizing Topology Dynamics?.

E N D
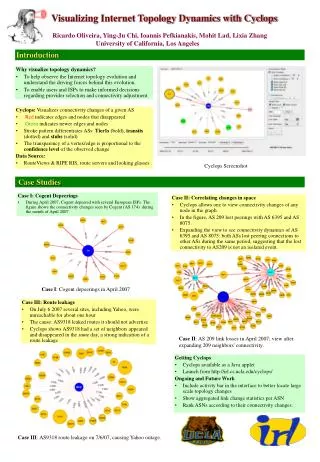
Visualizing Internet Topology Dynamics with Cyclops Ricardo Oliveira,Ying-Ju Chi, Ioannis Pefkianakis, Mohit Lad, Lixia Zhang University of California, Los Angeles Speaker: Ricardo Oliveira rveloso@cs.ucla.edu
Why Visualizing Topology Dynamics? “Can someone tell me if there are any tools on the net we can use to evaluate ISP X as a possible Tier 1 peer?” Post @ Nanog mailing list, 5/14/2007 • One approach is to understand how connectivity of an ISP is changing over time • E.g. has ISP X been loosing customers recently? • helps in making intelligent choices about who to connect to
What to visualize • Changes in AS nodes and AS-links • When • Where • Challenge: scaling the visualization • We developed Cyclops • Starting with a specific AS and its neighbors • Display connectivity changes over time • Selectively display connectivity of other ASes
Our data sources • BGP routing tables + updates: Route Views, RIPE, Abilene, CERNET • Route Servers: Packet Clearing House, UC Riverside, traceroute.org, Route Server Wiki • Looking Glasses: traceroute.org, Looking Glass Wiki The more the better: if you store your BGP feeds and make them available please let me know!
Cyclops user interface Peerings lost New peerings New AS Timeline Dead AS Starting point “cyclops eye”
Case #1: Cogent depeerings thickness ~ link age April 2007 Cyclops shows how connectivity is changing over time
Case #2: Correlating changes Y Z X thickness ~ # routes carried Link age and relative age Cyclops enables visual correlation of events across space
Your input is most appreciated! • Grab me afterwards • Play with our prototype • Tell me what features you like, what you don't, what you want to see added • Planning on a beta release of the tool by September 2007
Send all questions and comments to rveloso@cs.ucla.edu Thanks!