Download
1 / 1
10 likes | 122 Views
Ricardo Oliveira, Ying-Ju Chi, Ioannis Pefkianakis, Mohit Lad, Lixia Zhang University of California, Los Angeles . Visualizing Internet Topology Dynamics with Cyclops. Introduction. Why visualize topology dynamics?

E N D
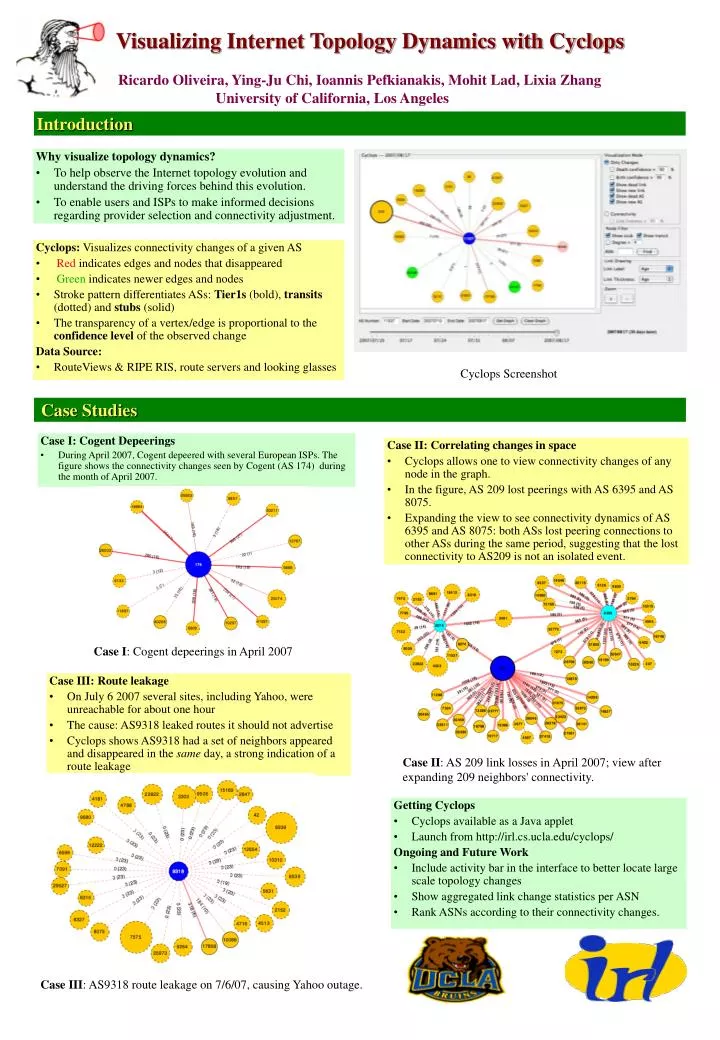
Ricardo Oliveira, Ying-Ju Chi, Ioannis Pefkianakis, Mohit Lad, Lixia Zhang University of California, Los Angeles Visualizing Internet Topology Dynamics with Cyclops Introduction Why visualize topology dynamics? • To help observe the Internet topology evolution and understand the driving forces behind this evolution. • To enable users and ISPs to make informed decisions regarding provider selection and connectivity adjustment. Cyclops: Visualizes connectivity changes of a given AS • Red indicates edges and nodes that disappeared • Green indicates newer edges and nodes • Stroke pattern differentiates ASs: Tier1s (bold), transits (dotted) and stubs (solid) • The transparency of a vertex/edge is proportional to the confidence level of the observed change Data Source: • RouteViews & RIPE RIS, route servers and looking glasses Cyclops Screenshot Case Studies Case I: Cogent Depeerings • During April 2007, Cogent depeered with several European ISPs. The figure shows the connectivity changes seen by Cogent (AS 174) during the month of April 2007. Case II: Correlating changes in space • Cyclops allows one to view connectivity changes of any node in the graph. • In the figure, AS 209 lost peerings with AS 6395 and AS 8075. • Expanding the view to see connectivity dynamics of AS 6395 and AS 8075: both ASs lost peering connections to other ASs during the same period, suggesting that the lost connectivity to AS209 is not an isolated event. Case I: Cogent depeerings in April 2007 Case III: Route leakage • On July 6 2007 several sites, including Yahoo, were unreachable for about one hour • The cause: AS9318 leaked routes it should not advertise • Cyclops shows AS9318 had a set of neighbors appeared and disappeared in the same day, a strong indication of a route leakage Case II: AS 209 link losses in April 2007; view after expanding 209 neighbors' connectivity. Getting Cyclops • Cyclops available as a Java applet • Launch from http://irl.cs.ucla.edu/cyclops/ Ongoing and Future Work • Include activity bar in the interface to better locate large scale topology changes • Show aggregated link change statistics per ASN • Rank ASNs according to their connectivity changes. Case III: AS9318 route leakage on 7/6/07, causing Yahoo outage.