Download

1 / 27
270 likes | 334 Views
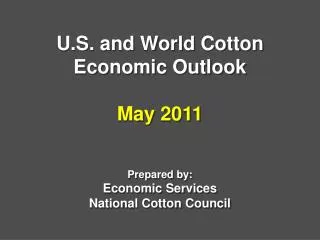
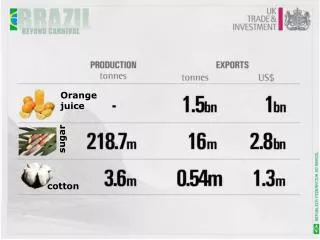
U.S. Cotton Supply. December Cotton Futures. Cents per Pound. 2007 U.S. Planting Intentions. Thousand Acres. 2006 2007 % Actual Intentions* Change. Southeast 3,353 2,545 -24.1 Mid-South 4,235 2,910 -31.3 Southwest 6,835 5,970 -12.7 West 525 430 -18.1

E N D
December Cotton Futures Cents per Pound
2007 U.S. Planting Intentions Thousand Acres 2006 2007 % Actual Intentions* Change Southeast 3,353 2,545 -24.1 Mid-South 4,235 2,910 -31.3 Southwest 6,835 5,970 -12.7 West 525 430 -18.1 ALL UPLAND14,94811,855-20.7 ALL ELS 326 292 -10.4 ALL COTTON 15,274 12,147 -20.5 *USDA-NASS Prospective Plantings Report
U.S. Cotton Production *USDA 2007 Ag Outlook Forum Estimates
U.S. Cotton Supply *USDA 2007 Ag Outlook Forum Estimates
U.S. Cotton Mill Use(Crop Year, Million Bales) *USDA 2007 Ag Outlook Forum Estimates
U.S. Cotton Production & Use *USDA 2007 Ag Outlook Forum Estimates
China Cotton Supply & Use *USDA 2007 Ag Outlook Forum Estimates
World Cotton Production *USDA 2007 Ag Outlook Forum Estimates
World Fiber Mill Use *PCI
Foreign Cotton Production & Use *USDA 2007 Ag Outlook Forum Estimates
U.S. Cotton Exports *USDA 2007 Ag Outlook Forum Estimates
World Cotton Ending Stocks *Based on USDA 2007 Ag Outlook Forum Estimates
U.S. Supply and DemandMillion Bales Beginning Stocks 6.05 9.20 Production 21.57 20.00 Imports 0.02 0.00 Total Supply 27.63 29.20 Mill Use 4.95 4.50 Exports 13.50 18.00 Total Offtake* 18.45 22.50 Ending Stocks 9.20 6.70 Stocks-to-Use Ratio 49.9% 29.8% 2006/07 2007/08 *Includes unaccounted **Based on USDA 2007 Ag Outlook Forum Estimates
World Supply and DemandMillion Bales 2006/07 2007/08 Beginning Stocks 53.80 52.59 Production 116.79 117.00 Imports 38.30 45.50 Mill Use 121.88 125.00 Exports 37.79 45.00 Ending Stocks 52.59 49.09 Stocks-to-Use Ratio 43.1% 39.3% **Based on USDA 2007 Ag Outlook Forum Estimates
2007 ACSA CONVENTION • FOUR SEASONS HOTEL • IRVING, TEXAS • MAY 24TH – MAY 26TH , 2007