Download
1 / 26
260 likes | 273 Views
A Petrophysical Comparison of the Barnett and Woodford Shales. Jeff Kane Bureau of Economic Geology PBGSP Annual Meeting February 26-27, 2007. Overview. Modeling the Barnett mineralogy – problems and solutions A look at the Woodford – a compare and contrast approach

E N D
A Petrophysical Comparison of the Barnett and Woodford Shales Jeff Kane Bureau of Economic Geology PBGSP Annual Meeting February 26-27, 2007
Overview • Modeling the Barnett mineralogy – problems and solutions • A look at the Woodford – a compare and contrast approach • Finish up – possible ramifications of the differences Jeffrey A. Kane, Bureau of Economic Geology , PBGSP Annual Meeting, February 26-27, 2007
Constituents of the Barnett – XRD data (weight %) Data from 64 samples with the exception of 35 samples for siderite and 325 samples for Kerogen/TOC. Jeffrey A. Kane, Bureau of Economic Geology , PBGSP Annual Meeting, February 26-27, 2007
Constituents of the Barnett – Kerogen weight fraction estimation (from Guidry and Olszewski, 1990) where: Wk is the weight fraction of kerogen in the sample TOC is the weight fraction of total organic carbon in the sample S1 is the weight fraction of free oil in the rock sample CS1 is the weight fraction of carbon in the free oil and Ck is the weight fraction of carbon in the kerogen Guidry and Olszewski (1990) suggest 0.87 and 0.75 for CS1 and Ck respectively. Jarvie (1999) recommends a value of 0.83 for CS1. Jeffrey A. Kane, Bureau of Economic Geology , PBGSP Annual Meeting, February 26-27, 2007
Log response – Log models work in volume fractions where: Vi is the volume fraction of constituent i Wi is the weight fraction of constituent i rB is the bulk density ri is the density of constituent i Jeffrey A. Kane, Bureau of Economic Geology , PBGSP Annual Meeting, February 26-27, 2007
Constituents of the Barnett – XRD data (weight %) Data from 64 samples with the exception of 35 samples for siderite and 325 samples for Kerogen/TOC. Jeffrey A. Kane, Bureau of Economic Geology , PBGSP Annual Meeting, February 26-27, 2007
Constituents of the Barnett – XRD data (volume %) Data from 64 samples with the exception of 35 samples for siderite and 325 samples for Kerogen/TOC. Jeffrey A. Kane, Bureau of Economic Geology , PBGSP Annual Meeting, February 26-27, 2007
Log response – Kerogen • Kerogen • Density about 1 to 1.2 gm/cc; however probably more variable than this range suggests (Guidry and Olszewski, 1990; Jarvie, personal communication; Mendelson and Toksöz, 1985) • Modeling work suggests that 1 gm/cc works reasonably well Jeffrey A. Kane, Bureau of Economic Geology , PBGSP Annual Meeting, February 26-27, 2007
Log response – Kerogen • Kerogen • Has a hydrogen index of 0.65 to 0.8 (with water having a hydrogen index of 1.0) (Mendelson and Toksöz, 1985) • Again modeling work shows a value of 0.8 works reasonably well • Does not conduct electricity • The organic material responsible for kerogen also tends to fix uranium during deposition Jeffrey A. Kane, Bureau of Economic Geology , PBGSP Annual Meeting, February 26-27, 2007
Estimation of Kerogen from log data (uranium) – Blakely #1 Jeffrey A. Kane, Bureau of Economic Geology , PBGSP Annual Meeting, February 26-27, 2007
Blakely #1 Jeffrey A. Kane, Bureau of Economic Geology , PBGSP Annual Meeting, February 26-27, 2007
Estimation of Kerogen from log data (total gamma ray) – Blakely #1 Jeffrey A. Kane, Bureau of Economic Geology , PBGSP Annual Meeting, February 26-27, 2007
Log response – Pyrite • Pyrite • Density (RHOB) reads 5.0 gm/cc • 1% pyrite shifts density log by about 0.023 gm/cc (Clavier and others, 1976) • The photoelectric factor (PEF) reads 17 b/e • The thermal neutron log (NPHI, CNC, etc.) reads -2% in pure pyrite • Appears to vary with porosity (Clavier and others, 1976) Jeffrey A. Kane, Bureau of Economic Geology , PBGSP Annual Meeting, February 26-27, 2007
Log response – Pyrite • Pyrite • The resistivity of pyrite ranges from 0.00001 - 0.8 ohmm • The affect on logs varies with measurement frequency (induction logs are more affected than laterologs) and distribution in the rock • As little as 3% pyrite by volume can cause a reduction of 50% in the measured resistivity for an induction log (Clavier and others, 1976) • Fortunately it doesn’t affect the gamma ray Jeffrey A. Kane, Bureau of Economic Geology , PBGSP Annual Meeting, February 26-27, 2007
Log response – Pyrite (T.P. Sims #2) Jeffrey A. Kane, Bureau of Economic Geology , PBGSP Annual Meeting, February 26-27, 2007
Constituents of the Barnett – XRD data (volume %) Data from 64 samples with the exception of 35 samples for siderite and 325 samples for Kerogen/TOC. Jeffrey A. Kane, Bureau of Economic Geology , PBGSP Annual Meeting, February 26-27, 2007
Constituents of the Barnett – XRD data (model volume %) Data from 64 samples with the exception of 35 samples for siderite and 325 samples for Kerogen/TOC. Jeffrey A. Kane, Bureau of Economic Geology , PBGSP Annual Meeting, February 26-27, 2007
Petrophysical modeling - T. P. Sims #2 Jeffrey A. Kane, Bureau of Economic Geology , PBGSP Annual Meeting, February 26-27, 2007
Constituents of the Barnett – XRD and log derived data (model volume %) Constituents of the Barnett – XRD data (model volume %) XRD data from 64 samples with the exception of 35 samples for siderite and 325 samples for Kerogen/TOC. Log data from entire Barnett interval of T. P. Sims #2 XRD data from 64 samples with the exception of 35 samples for siderite and 325 samples for Kerogen/TOC. Jeffrey A. Kane, Bureau of Economic Geology , PBGSP Annual Meeting, February 26-27, 2007
To review • A reasonable compositional model is available for the Barnett accounting for the presence of kerogen, pyrite, non-clay silicates, carbonate material and clay. • It requires at a minimum, gamma ray, compressional sonic, neutron, density, PEF, and resistivity logs. • Sufficient information to derive a direct relationship between kerogen volume and log data (i.e. GR) is necessary for model stability • The analysis can be enhanced with the inclusion of a spectral gamma ray Jeffrey A. Kane, Bureau of Economic Geology , PBGSP Annual Meeting, February 26-27, 2007
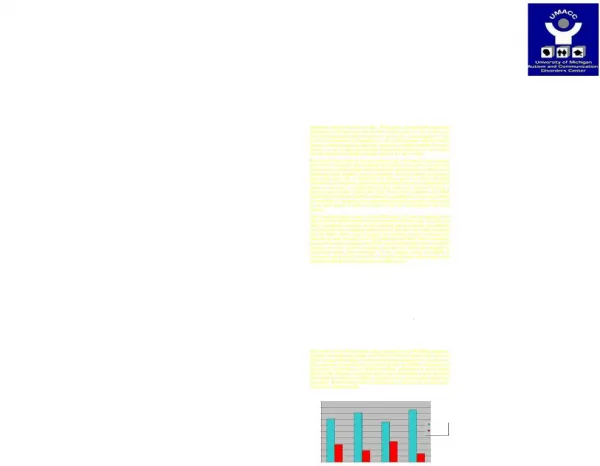
Comparison of the Barnet and Woodford – XRD data (volume %) Constituents of the Barnett – XRD data (volume %) Data from 64 samples with the exception of 35 samples for siderite and 325 samples for Kerogen/TOC. Barnett data from 64 samples with the exception of 35 samples for siderite and 325 samples for Kerogen/TOC. Woodford data from 49 samples with the exception of 106 samples for Kerogen/TOC Jeffrey A. Kane, Bureau of Economic Geology , PBGSP Annual Meeting, February 26-27, 2007
Uranium content – Barnett and Woodford Uranium (ppm) distribution in Woodford (CBP) Uranium (ppm) distribution in Barnett (Blakely #1) Jeffrey A. Kane, Bureau of Economic Geology , PBGSP Annual Meeting, February 26-27, 2007
Uranium distribution – Barnett - Pervasive (more or less) – Blakely #1 Jeffrey A. Kane, Bureau of Economic Geology , PBGSP Annual Meeting, February 26-27, 2007
Uranium distribution – Woodford – Stratigraphic controls? - CBP Jeffrey A. Kane, Bureau of Economic Geology , PBGSP Annual Meeting, February 26-27, 2007
To conclude • A reasonable compositional model is available for the Barnett accounting for the presence of kerogen, pyrite, non-clay silicates, carbonate material and clay. • This model appears to also work in the Woodford with differing clay parameters (illite-corensite vs. illite-smectite). • It requires at a minimum, gamma ray, compressional sonic, neutron, density, PEF, and resistivity logs. • Sufficient information to derive a direct relationship between kerogen volume and log data (i.e. GR) is necessary for model stability. Such a relationship exists in the Barnett and can be assumed to exist in the Woodford. • The analysis can be enhanced with the inclusion of a spectral gamma ray in the log suite. • Better kerogen estimation and better stratigraphic correlation Jeffrey A. Kane, Bureau of Economic Geology , PBGSP Annual Meeting, February 26-27, 2007
To conclude • The Woodford has about 50% more clay per unit volume than the Barnett. This will affect the mechanical properties and probably means that frac jobs will be less efficient in the Woodford with respect to the Barnett • This invites an area of investigation involving mechanical properties in the two formations (subtle hint for shear sonic data) • The Woodford also has about half the kerogen per unit volume than the Barnett. Pressure and temperature arguments aside, this will lower the gas in place numbers with respect to the Barnett. • The kerogen distribution in the Woodford appears to have stronger stratigraphic controls on it than in the Barnett Jeffrey A. Kane, Bureau of Economic Geology , PBGSP Annual Meeting, February 26-27, 2007