Download
1 / 22
230 likes | 429 Views
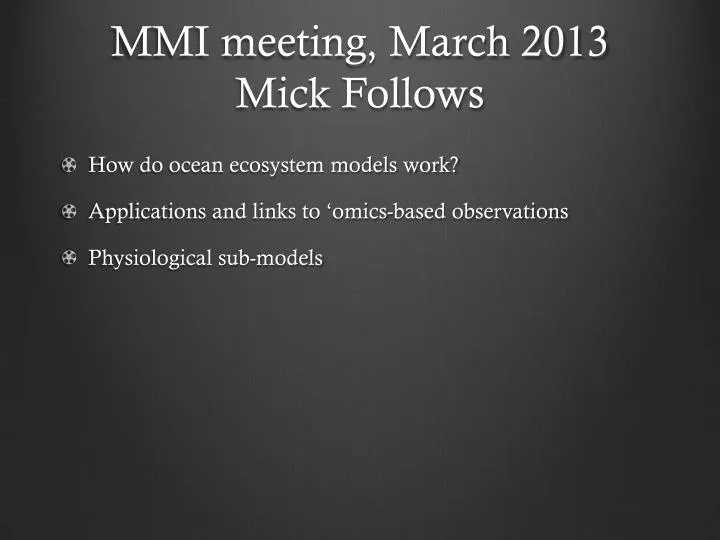
MMI meeting, March 2013 Mick Follows. How do ocean ecosystem models work? Applications and links to ‘ omics -based observations Physiological sub-models. Observed seasonal variation of phytoplankton at Georges Bank. Phytoplankton, B. J F M A M J J A S O N D. month.

E N D
MMI meeting, March 2013Mick Follows • How do ocean ecosystem models work? • Applications and links to ‘omics-based observations • Physiological sub-models
Observed seasonal variation of phytoplankton at Georges Bank Phytoplankton, B J F M A M J J A S O N D month G. Riley, J. Marine Res. 6, 54-73 (1946)
Riley’s mechanistic model Rate of growth respiration grazing change B = phytoplankton biomass (mol C m-3) Z = zooplankton biomass (mol C m-3) μ= growth rate (s-1) K = respiration rate (s-1) g = grazing rate (s-1 (mol C m-3)-1)
Parameterization of growth Riley (1946) Monod (1942)
Riley’s mechanistic model theoretical curve observed Phytoplankton, B J F M A M J J A S O N D growth respiration grazing
Extending Riley’s model Phytoplankton • Monod and Droop kinetics • NPZ-type models • e.g. Steele (1958) g P μ Kr N Z Nutrient Zooplankton
Multiple resources, diverse populations • Functional group models – multiple phytoplankton types • e.g. Chai et al (2002), Moore et al (2002) P P Z N D N1 N2
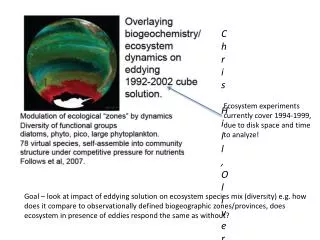
Remotely sensed chlorophyll NASA MODIS • MOVIE – removed for compactness Comparison of remotely sensed and simluated surface ocean chlorophyll Ocean model
Phytoplankton diversity predicted by ocean model Ocean model resolving O(100) phytoplankton types
Measures of diversity • Data Fuhrman et al (2008), model Barton et al (2010) Fuhrman et al (2008)
Genomic mapping of ecotypes with known physiologies • Prochloroccocus • Data Johnson et al (2006); model Follows et al (2007)
Mapping of abundance of specific functional types • Data Church et al (2008), model Monteiro et al (2010)
Mapping of abundance of specific functional types • Data from Luo et al (2012)
Trade-offs define biogeography • Trade-offs for diazotrophy • not dependent on fixed nitrogen • high iron quota • slow maximum growth rate Ocean model Fanny Monteiro
Interpretation • Resource ratio perspective (Tilman, 1982) • Relative rates of delivery of N, P, Fe define range of diazotrophs (Ward et al, 2013; submitted)
Why do diazotrophs grow so slowly? • Why do nitrogen fixers grow slowly?
Physiological models For biogeochemical modeling purposes we would like: • Flexible and prognostic elemental ratios • Mechanistic understanding/parameterizations of population growth rates • Relatively few state variables for computational tractability
Must be backwards compatible 1940s 1960s 1970s 2000s Monod/ Droop/CaperonShuter, McCarty Metabolic Redfield Internal stores Macro-molecular reconstruction, FBA Flexible elemental ratios Few state variables Generalized framework for heterotrophs/phototrophs fixed elemental Ratios, 1 state variable Prognostic elemental ratios (Ecological Stoichiometry)
Model of AzotobacterVinelandii • Nitrogen fixing soil bacteria • Conserve internal fluxes of mass, electrons and energy • McCarty (1965), Vallino et al (1996) … • Biophysical model of substrate and O2 uptake • Pasciak and Gavis (1974), Staal et al (2003), … • Demand intra-cellular O2 ~ 0 O2 CO2 Molecular diffusion O2 CO2 “biomass” C5H7O2N pyruvate NH4+ sucrose N2 Keisuke Inomura
Laboratory data: continuous culture Kuhle and Oetze (1988) Model (Keisuke Inomura) [O2] Low yields in oxygenated medium Slow growth rates if substrate limited
Genome-scale metabolic reconstructions and Flux Balance Analysis e.g. Palsson, Systems Biology, (2006)
Genome-scale models: Flux Balance Analysis • Reconstruction of significant fraction of metabolic pathways (e.g. Palsson, 2006) • Explicit model of equilibrium fluxes • e.g. Varma and Palsson (1994) • predicts yield as function of substrate