Download
1 / 25
350 likes | 965 Views
XRD X-ray diffraction. Dr. Karin Habermehl-Cwirzen. 1895- Röntgen publishes the discovery of X-rays 1912- Laue observes diffraction of X-rays from a crystal (Nobel prize 1914).

E N D
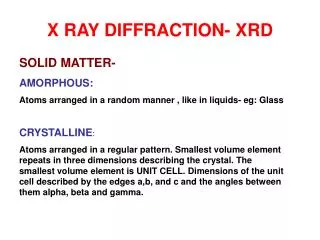
XRD X-ray diffraction Dr. Karin Habermehl-Cwirzen
1895- Röntgen publishes the discovery of X-rays 1912- Laue observes diffraction of X-rays from a crystal (Nobel prize 1914)
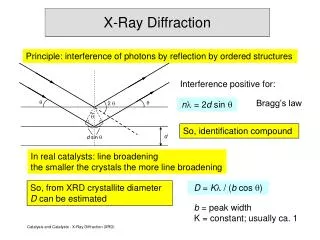
Diffraction happens when waves interact with regular structures, whose repeat distance is about the same as the wavelength. X-rays having a wavelength of a few Å, can be used to study interatomic distances.
Bragg’s law nλ = 2 d sin θ Constructive interference only occurs for certain θ’s correlating to a plane, specifically when the path difference is equal to n wavelengths. d distance between similar atomic planes Θ angle of diffraction λ wavelength of the incident X-rays n an integer 1,2,3... by Wesley Tennyson
When a diffraction condition is met there can be a reflected X-ray • (Extra atoms in the basis can suppress reflections) • Three variables λ, θ, and d • λ is known • θ is measured in the experiment (2θ) • d is calculated
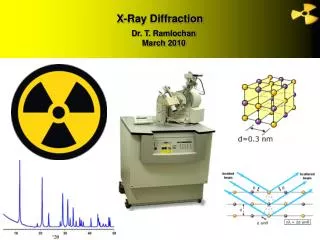
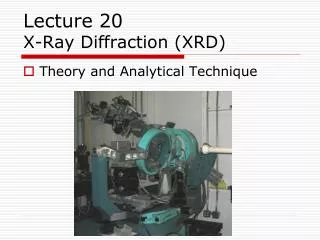
A diffractometer can be used to produce a diffraction pattern of any crystaline solid. An unknown mineral can be identified Charaterization of atomic-scale structure X-ray source: high voltage (40.000V) difference between a filament and a target Electrons from the filament are accelerated by the voltage difference and hit the (Cu, Mo, Co, Fe, Cr or W) target with enough energy to start the X-ray process. The radiation is monochromatized by filters like Zr for Mo, Ni for Cu, Fe for Co, Mn for Fe and V for Cr.
A diffraction pattern records the X-ray intensity as a function of 2-theta angle. To run a step-scan we mount a specimen, set the tube voltage and current, and enter the following parameters: --A starting 2-theta angle. --A step-size (typically 0.005 degrees). --A count time per step (typically 0.05-1 second). --An ending 2-theta angle. Once started, the goniometer moves through its range, stopping at each step for the alotted time. The X-ray counts at each step are saved to a file on the computer. source: http://www.geosci.ipfw.edu/XRD/techniqueinformation.html
When solving scientific problems it is often useful to ask three questions: What do I know? What can I measure? What do I want to find out? In Bragg's law: 1. we know λ (the wavelength) = 1.54 Å (copper Kα and we assume n=1. 2. We can measure 2θ from the diffraction pattern. Divided by 2, these values become θ. 3. That leaves us with an equation with one unknown -d- the d-spacing we want to find out. X-ray peak, with the smallest angle, which was measured as 23.04 degrees. Solving Bragg's Law (with n=1 and wavelength=1.54 Å) we find that 23.04 degrees 2θ corresponds to a d-spacing of 3.86Å For an unknown sample generally 3 peaks are enough to state the existence of this certain substance. source: http://www.geosci.ipfw.edu/XRD/techniqueinformation.html
Smaller Crystals Produce Broader XRD Peaks by Wesley Tennyson
Scherrer equation (crystal size effect) Scherrer used X-rays to estimate the crystallite size of nanophase materials (1918) Peak width B is inversely proportional to crystallite size L B FWHM (full width at half max) K constant dependent on crystallite shape (often approximated to be 1) L thickness of crystallite λ X-ray wavelength Θ Bragg angle
What is B? B = (2θ High) – (2θ Low) B is the difference in angles at half max 2θ low 2θ high by Wesley Tennyson
And K? • The Scherrer Constant, K depends how the width is determined, the shape of the crystal, and the size distribution • the most common values for K are: • 0.94 for FWHM of spherical crystals with cubic symmetry • 0.89 for integral breadth of spherical crystals w/ cubic symmetry • 1, because 0.94 and 0.89 both round up to 1 • K actually varies from 0.62 to 2.08 • Remember, crystallite size is different than particle size. • A particle may be made up of several different crystallites. • Crystallite size often matches grain size, but there are exceptions. • Though the shape of crystallites is usually irregular, we can often approximate them as: sphere, cube, tetrahedra, needles or plates prisms or cylinders. • Most applications of Scherrer analysis assume spherical crystallite shapes • If we know the average crystallite shape from another analysis, we can select the proper value for the Scherrer constant K • Scherrer equation can be used for crystals smaller than 200-300nm. source http://prism.mit.edu/xray
Intensity (a.u.) 66 67 68 69 70 71 72 73 74 2q(deg.) Which of these diffraction patterns comes from a nanocrystalline material? • These diffraction patterns were produced from the exact same sample! • Two different diffractometers, with different optical configurations, were used • The apparent peak broadening is due solely to the instrumentation • The peak widths from the instrument peak profile are a convolution of: • X-ray Source Profile: Wavelength widths of Kα1 and Kα2 lines • Size of the X-ray source, Superposition of Kα1 and Kα2 peaks • Goniometer Optics: Imperfect focusing, Beam size source http://prism.mit.edu/xray
X-RAY DIFFRACTOMETRY OF CLINKER AND CEMENT X-ray diffraction data of tens of thousands of materials is readily available nowadays. For studies of phase transformations or chemical reactions: temperature chambers e.g. -270°C to 2700°C !
Alite (C3S) XRD patterns of alite polymorphs are closely alike and interpretation becomes difficult.
Belite (C2S) Each phase of cement produces a unique diffraction pattern.In the majority of clinkers the belite phase is predominately or entirely in the β-polymorphic state
Aluminoferrite Phase XRD of clinker ferrites are affected by the cooling rate of the clinker. This scan shows the aluminoferrite phase, which were produced at different plants.
Each phase of cement produces a unique diffraction pattern. The intensity of each pattern is proportional to the concentration in the mix. However, the patterns are complex with many overlaps – peak intensity measurements can be difficult. With ever increasing importance of blended cements such as Portland pozzolana or slag cement and use of a variety of blending materials, the assessment of quality and estimation of quantity present in a cement have turned out to be an essential process control step.
Internal Standard Method mixtures of known concentrations of synthetically prepared four pure phases are prepared along with an internal standard (rutile,silicon, KBr, CaF2, or corundum), interground blended thoroughly measuring the intensities in all the mixtures with the various phases in known concentrations known weight of internal standard is ground with the sample under investigation and the corresponding values are determined for each phase.
XRD spectrum of mortar 1 C C C C C=calcite, Q=quartz, P,S= Petalite/Spodumene, F=feldspar) Parts of samples were ground – XRD – PANanalytical peak identification