Download
1 / 37
380 likes | 599 Views
Why We Need a Coastal Weather Radar Cliff Mass Department of Atmospheric Sciences University of Washington. Northwest Coastal Radar Problem. The Pacific Northwest has the worst coastal radar coverage of any region of the lower 48-states.

E N D
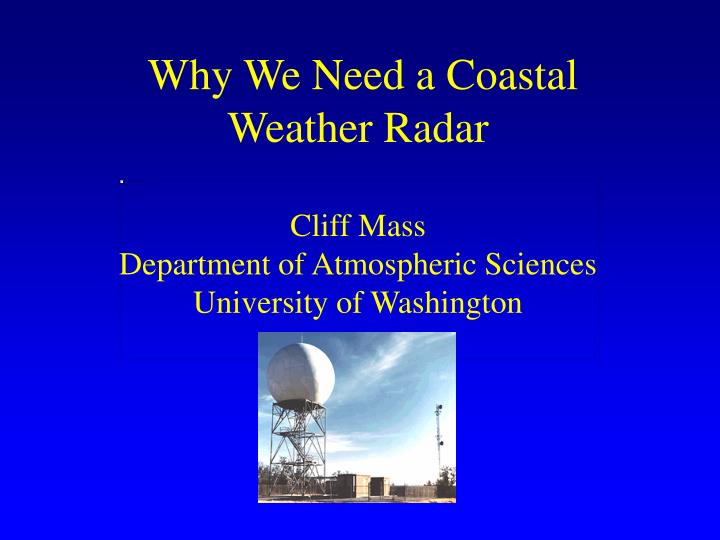
Why We Need a Coastal Weather RadarCliff Mass Department of Atmospheric SciencesUniversity of Washington
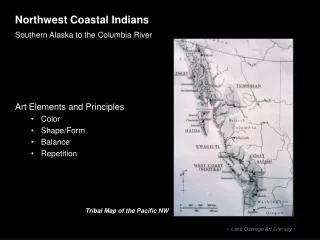
Northwest Coastal Radar Problem • The Pacific Northwest has the worst coastal radar coverage of any region of the lower 48-states. • There is virtually no radar coverage for the lower atmosphere over the coastal zone and the near-shore waters. • It is particularly disturbing that such poor coverage exists for a region of often intense storms AND a great deal of military, shipping, fishing and other marine traffic.
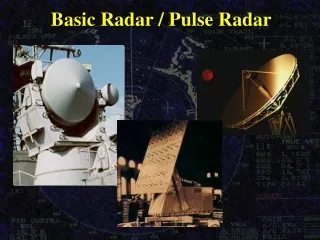
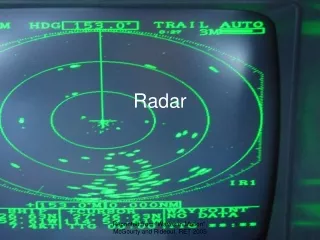
Weather Radar 101 • Modern weather radars can see where it is precipitating • Doppler radars can also get the air velocity • Radars can track storms, fronts, and other major features • Can tell how much rain is falling over a broad area…including mountain slopes. • An essential tool for the National Weather Service and other meteorologists.
When Hurricane Katrina Approached the Gulf Coast Radar Clearly Showed the Threat
The right diagram indicates the effective coverage of the Weather Service radars (at 3-km, above mean sea level), with hatching indicating substantial blockage.
Radar coverage for the lowest beam (.5 degree elevation angle) for the current network. Red areas indicate no coverage below 8000 m (25,000 ft). Radar coverage calculations by Ken Westrick
The Implications of Poor Coastal Radar Coverage • Northwest forecasters often have a poor idea of the structure of weather systems approaching the area. • There have been several major forecast failures in the 0-24 h range that could have been mitigated if coastal radar coverage was better. • The ability to provide short-term forecasts (nowcasting) over western Oregon and Washington is greatly lessened.
February 7, 2002 • On the morning of 7 February 2002 an intense low center moved into the central Oregon coast, with absolutely no warnings by the National Weather Service. • Produced strong winds with gusts exceeding 70 mph
A surprise storm in southern Oregon on February 7, 2002 caused massive tree falls and damageNO WARNINGS!!
The Implications of Poor Coastal Radar Coverage • With no low level Doppler wind and reflectivity from radar, critical warnings and weather guidance over the coastal zone are degraded. No assistance for emergency situations, pollutant spills, and the like. When the New Carisa grounded Near Coos Bay, Oregon, there was no radar coverage to help manage salvage operations.
The Implications of Poor Coastal Radar Coverage • There is no radar coverage of the heavy orographic precipitation on the western and southern sides of the Olympics and coastal mountains….thus, degrading flood and river forecasting.
The Implications of Poor Coastal Radar Coverage • There is a distinct lack of weather data offshore for use in initializing weather prediction models along and off the coast. A coastal radar would provide both Doppler winds and reflectivities (where it is raining) that could be assimilated into the models. Without such radars, future short-term forecast skill of weather features approaching our coast will be limited.
We Do Get Hurricane Strength Storms Major storms do occur here in the NW and without coastal radars we can not determine the structure and position as well as we should Example: Columbus Day Storm of 1962: Winds Exceeded 150 mph in places with catastrophic damage
An Extraordinary Event • Hurricane-Force Winds Struck the Entire Washington Coast • At North Head sustained (5 minute average) winds reached 126 mph, with a maximum one-minute wind of 150 mph before the sensor failed. • At Tatoosh Island, 150 miles to the north, winds reached 110 mph. • At Astoria, on the south side of the Columbia, there were unofficial reports of gusts to 130 mph.
An Extraordinary Event It was estimated that 80% of the mature timber near North Head was razed during this storm and 7-8 BILLION board feet of timber was downed over coastal Washington– eight times that blown down by Mt. St. Helens, and roughly the entire current annual harvest for the entire Pacific Northwest today.
In some areas over 40% of the trees were blown down As a result, this event has become known as the “The Olympic Blowdown Storm”
The Most Extreme Northwest Windstorm: The Columbus Day Windstorm of 12 October 1962
The Big One • The Columbus Day Storm was the most damaging windstorm to strike the Pacific Northwest in 150 years. • An extensive area, stretching from northern California to southern British Columbia experienced hurricane-force winds, massive treefalls, and power outages. • In Oregon and Washington, 46 died and 317 required hospitalization as a result of the storm. • Fifteen billion board feet of timber worth 750 million $ were downed, 53,000 homes were damaged, thousands of utility poles were toppled, part of the roof of Portland’s Multnomah stadium was torn off, and the twin 520 ft steel towers that carried the main power lines of Portland were crumpled. • At the height of the storm approximately one million homes were without power in the two states, and total damage was conservatively estimated at a quarter of a billion (1962) dollars.
Columbus Day 1962: At Cape Blanco there were 150 mph with gusts to 179! Strongest winds on bluffs and windward slopes of coastal orography
Feb. 13, 1979: Winds over 100 kts destroyed the Hood Canal Bridge Cost to replace: over 100 million dollars
February 13 1979: The Hood Canal Storm
The Solution: Acquisition of Additional Coastal Radars • By adding one or two coastal radars, the National Weather Service could greatly improve the current situation. • Although the NWS radar (WSR-88D )production line is now closed, Enterprise Electronics has a similar (if not better) product available (DWSR-8501S/K). • Cost: Approximately $ 4.5 million per radar, plus installation costs and maintenance.
Enterprise DWSR-8501S/K Doppler Radar. The National Weather Service has already purchased two of these to fill in their radar network.
Now With Two New Radars
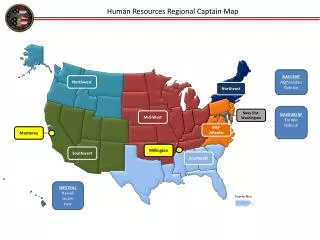
Acquisition of Additional Coastal Radars • Ideally two radars would be acquired with one positioned on the central WA coast (e.g., Westport) and the other on the central Oregon coast (Florence) • If we could secure only one, Westport would be the best choice…since it provides coverage of entrances to both the Columbia River and the Strait.
For More Information Checkthe Web Site http://www.atmos.washington.edu/~cliff/coastalradar.html
Coverage over the Pacific Northwest at or below 2-km: Where the real weather is!