Download
1 / 7
70 likes | 282 Views
Practical. WORKING WITH ARABIDOPSIS AFFYMETRIX DATA Day1 Data Sources, Normalisation and NASC Affy Web Site Tools. OPTIONS. The Practical session is flexible so that you can concentrate on whatever interests you. You have choice of working through this practical or software tutorials

E N D
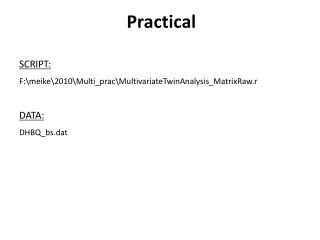
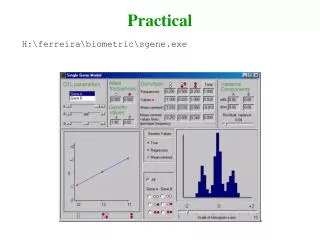
Practical WORKING WITH ARABIDOPSIS AFFYMETRIX DATA Day1 Data Sources, Normalisation and NASC Affy Web Site Tools
OPTIONS • The Practical session is flexible so that you can concentrate on whatever interests you. • You have choice of working through this practical • or software tutorials • or just trying things out and asking questions. • This PowerPoint file contains a short optional practical on data download and NASC tools. • a guided tour of these tools is also available at: http://affymetrix.arabidopsis.info/narrays/static/NASCArraysTutorial.pdf • J-Express is installed on all the computers in the room • The combination code for the room can be got from the school office • most recent version at start> All Programs> J-Express pro 2.5 • The shortcut on most desktops links to an older version • Zoë's talk can take you through several stages of its use • Paddy’s J-Express tutorial for spotted arrays can be found at: http://plantsci.arabidopsis.info/pg/jxtutorial.doc • GeneSpring is installed on Martin’s laptop, which will be available for use throughout the practical session. • D-Chip will be available on CD to be installed onto computers on request. • The day’s speakers will also be available to discuss their subjects. • others attending the workshop will have expertise to share too.
Download Data From NASC • Download data for selected Chips • over all genes • http://affymetrix.arabidopsis.info/narrays/experimentbrowse.pl • Try searching by keyword • E.g. Search for Auxin • Chose an experiment and click. • You could download whole experiment • Instead chose one chip and add it to your selection • Try searching by slide search • E.g. Search for ethylene treated petioles • chose one chip and add it to your selection • Try searching by tree view • E.g. Look for a root developmental series • E.g. Look for experiments done by Cathlene Eland • You could download whole experiment • Instead chose one chip and add it to your selection
Selection • Click Selection at the top of the page • You could download your selection • look at the options in the dropdown menu • Download data for selected Genes • over all chips • http://affymetrix.arabidopsis.info/narrays/help/psp-wbubn.html Bulk Gene Download
Spot Histories • http://affymetrix.arabidopsis.info/narrays/spothistory.pl • Enter “At4g18960” (agamous) and plot • Select a spot from the ATH1 chip • rather than those from the older AG chip • Click on the bar with the highest signal shown • All samples in this signal bracket are now listed below • Click on “Bio Source 1 Data” for any of those samples • Biological information on sample is now given (for all samples) • What do they have in common • What does this suggest about the gene • Repeat for “At5g09810” (actin) • What does the position of the peek suggest about the gene • Repeat for a gene you are interested in!
Gene Swinger • http://affymetrix.arabidopsis.info/narrays/geneswinger.pl • Enter “At4g18960” (agamous) and swing • Select a spot from the ATH1 chip • rather than those from the older AG chip • Experiments in which the gene most varies are now given • What do they have in common • What does this suggest about the gene • View an experiment that interests you • Repeat for a gene you are interested in!
Two Gene Scatterplot • http://affymetrix.arabidopsis.info/narrays/twogenescatter.pl • Enter “AT1G14920” (GAI) and “AT2G01570” (RGA) and plot • Select spots from the ATH1 chip • rather than those from the older AG chip • The relationship between the 2 genes is now visualised. • What does it suggest • Repeat for a gene you are interested in! • Think about: • If there are more points in one bracket then another along an axis then you must expect to see more outliers in that bracket. They do not necessarily signify a correlation. • Using log scales may lessen this illusion. • From the chip selection page (see slide 3), you can do a two gene scatterplot over your chosen chips only. This may help differentiate between (e.g.) a repression relationship within a tissue and two genes which are expressed in different tissues.