Download
1 / 16
160 likes | 321 Views
Practical. H:ferreirabiometricsgene.exe. Practical. Aim. Visualize graphically how allele frequencies, genetic effects, dominance, etc, influence trait mean and variance. Ex1. a=0, d=0, p=0.4, Residual Variance = 0.04, Scale = 2. Vary a from 0 to 1. Ex2.

E N D
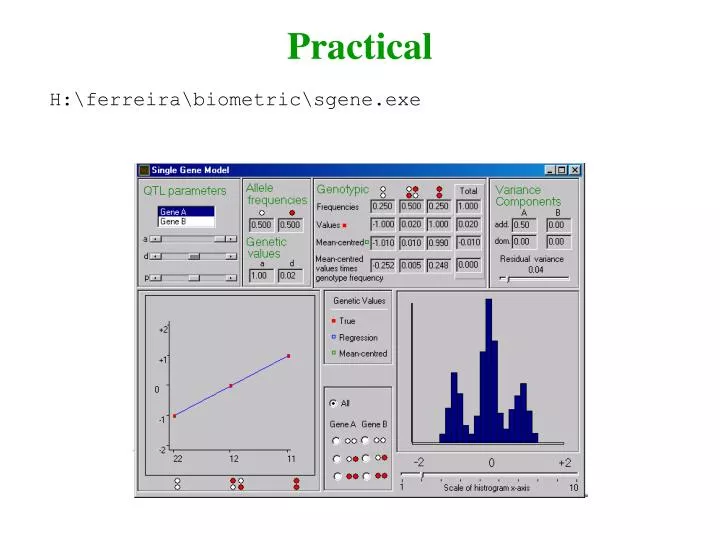
Practical H:\ferreira\biometric\sgene.exe
Practical Aim Visualize graphically how allele frequencies, genetic effects, dominance, etc, influence trait mean and variance Ex1 a=0, d=0, p=0.4, Residual Variance = 0.04, Scale = 2. Vary a from 0 to 1. Ex2 a=1, d=0, p=0.4, Residual Variance = 0.04, Scale = 2. Vary d from -1 to 1. Ex3 a=1, d=0, p=0.4, Residual Variance = 0.04, Scale = 2. Vary p from 0 to 1. Look at scatter-plot, histogram and variance components.
Some conclusions • Additive genetic variance depends on allele frequency p & additive genetic value a as well as dominance deviation d • Additive genetic variance typically greater than dominance variance
Biometrical model for single biallelic QTL 1. Contribution of the QTL to the Mean (X) 2. Contribution of the QTL to the Variance (X) 3. Contribution of the QTL to the Covariance (X,Y)
Biometrical model for single biallelic QTL 3. Contribution of the QTL to the Cov (X,Y) (a-m) Aa aa (-a-m) (d-m) AA (a-m)2 (a-m) AA (d-m) (a-m) (d-m) (d-m)2 Aa aa (-a-m)2 (-a-m) (-a-m) (d-m) (-a-m) (a-m)
Biometrical model for single biallelic QTL 3A. Contribution of the QTL to the Cov (X,Y) – MZ twins (a-m) Aa aa (-a-m) (d-m) AA p2 (a-m)2 (a-m) AA (d-m) (a-m) (d-m) (d-m)2 Aa 0 2pq aa (-a-m)2 (-a-m) (-a-m) (d-m) (-a-m) q2 0 (a-m) 0 Cov(X,Y) = (a-m)2p2 + (d-m)22pq + (-a-m)2q2 = VAQTL+ VDQTL =2pq[a+(q-p)d]2 + (2pqd)2
Biometrical model for single biallelic QTL 3B. Contribution of the QTL to the Cov (X,Y) – Parent-Offspring (a-m) Aa aa (-a-m) (d-m) AA p3 (a-m)2 (a-m) AA (d-m) (a-m) (d-m) (d-m)2 Aa p2q pq aa (-a-m)2 (-a-m) (-a-m) (d-m) (-a-m) q3 0 (a-m) pq2
e.g. given an AAfather, an AAoffspring can come from either AAx AAor AAx Aaparental mating types AAx AA will occur p2× p2 = p4 and have AA offspring Prob()=1 AAx Aa will occur p2× 2pq = 2p3q and have AA offspring Prob()=0.5 and have Aa offspring Prob()=0.5 Therefore, P(AA father & AAoffspring) = p4 + p3q = p3(p+q) = p3
Biometrical model for single biallelic QTL 3B. Contribution of the QTL to the Cov (X,Y) – Parent-Offspring (a-m) Aa aa (-a-m) (d-m) AA p3 (a-m)2 (a-m) AA (d-m) (a-m) (d-m) (d-m)2 Aa p2q pq aa (-a-m)2 (-a-m) (-a-m) (d-m) (-a-m) q3 0 (a-m) pq2 Cov (X,Y) = (a-m)2p3 + … + (-a-m)2q3 = ½VAQTL =pq[a+(q-p)d]2
Biometrical model for single biallelic QTL 3C. Contribution of the QTL to the Cov (X,Y) – Unrelated individuals (a-m) Aa aa (-a-m) (d-m) AA p4 (a-m)2 (a-m) AA (d-m) (a-m) (d-m) (d-m)2 Aa 2p3q 4p2q2 aa (-a-m)2 (-a-m) (-a-m) (d-m) (-a-m) q4 p2q2 (a-m) 2pq3 Cov (X,Y) = (a-m)2p4 + … + (-a-m)2q4 = 0
Biometrical model for single biallelic QTL 3D. Contribution of the QTL to the Cov (X,Y) – DZ twins and full sibs ¼ genome ¼ genome ¼ genome ¼ genome # identical alleles inherited from parents 2 1 (father) 0 1 (mother) ¼ (2 alleles) + ½ (1 allele) + ¼ (0 alleles) Unrelateds MZ twins P-O Cov (X,Y) = ¼ Cov(MZ) + ½ Cov(P-O) + ¼ Cov(Unrel) = ¼(VAQTL+VDQTL) + ½ (½ VAQTL) + ¼ (0) = ½ VAQTL + ¼VDQTL
Biometrical model predicts contribution of a QTL to the mean, variance and covariances of a trait Association analysis = a(p-q) + 2pqd Mean (X) Linkage analysis = VAQTL+ VDQTL Var (X) = VAQTL+ VDQTL Cov (MZ) On average! = ½VAQTL+ ¼VDQTL Cov (DZ) For a sib-pair, do the two sibs have 0, 1 or 2 alleles in common? 0, 1/2 or 1 0 or 1 IBD estimation / Linkage
1/3 Biometrical model for single biallelic QTL 2A. Average allelic effect (α) The deviation of the allelic mean from the population mean Allele a Population Allele A a(p-q) + 2pqd ? ? Mean (X) a A αa αA AA Aa aa Allelic mean Average allelic effect (α) a d -a Ap qap+dqq(a+d(q-p)) a p qdp-aq-p(a+d(q-p))
2/3 Biometrical model for single biallelic QTL Denote the average allelic effects - αA= q(a+d(q-p)) - αa= -p(a+d(q-p)) If only two alleles exist, we can define the average effect of allele substitution - α= αA - αa - α = (q-(-p))(a+d(q-p)) = (a+d(q-p)) Therefore: - αA= qα - αa= -pα
3/3 Biometrical model for single biallelic QTL 2A. Average allelic effect (α) 2B. Additive genetic variance The variance of the average allelic effects αA= qα αa= -pα Freq. Additive effect AA p2 = 2qα 2αA = (q-p)α αA+ αa 2pq Aa aa q2 2αa = -2pα VAQTL = (2qα)2p2 + ((q-p)α)22pq + (-2pα)2q2 =2pqα2 =2pq[a+d(q-p)]2 d= 0,VAQTL= 2pqa2 p=q,VAQTL= ½a2