Download
1 / 8
80 likes | 218 Views
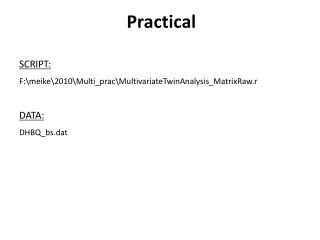
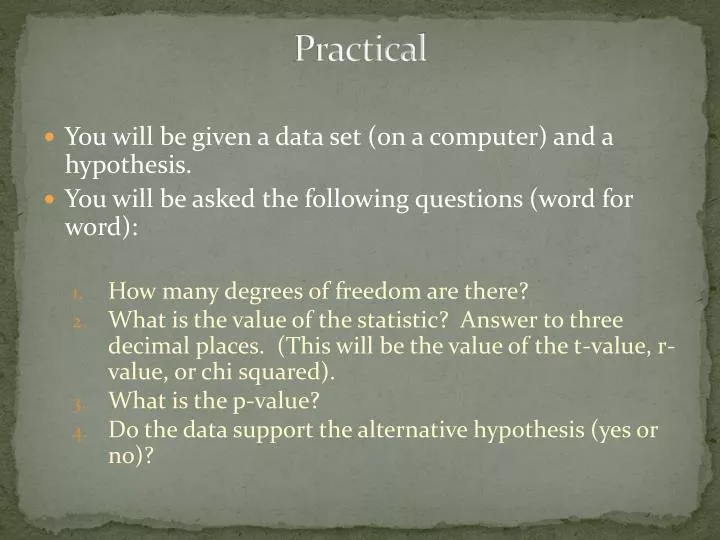
Practical. You will be given a data set (on a computer) and a hypothesis. You will be asked the following questions (word for word): How many degrees of freedom are there?

E N D
Practical • You will be given a data set (on a computer) and a hypothesis. • You will be asked the following questions (word for word): • How many degrees of freedom are there? • What is the value of the statistic? Answer to three decimal places. (This will be the value of the t-value, r-value, or chi squared). • What is the p-value? • Do the data support the alternative hypothesis (yes or no)?
Everyone will use Excel on a university computer. • All p-value cutoffs for statistical significance will be 0.05. • Statistical tables will be provided in the test spreadsheet. • This will be closed book and “closed computer.” Having any window open on your computer besides the test spreadsheet will be viewed as cheating. No external devices such as jump drives are allowed. • The formulas for t-test and chi squared will be given (but not labeled). • You will have one half hour. • July 25 and 26
How to prepare? • Know Excel functions for t-test and correlations • Mona Loa spreadsheet • Lab 1 (Working with Excel) and other past exercises • P. 5-6 in the manual (Summary of statistical tests) • Ask questions • Be sure you know how to figure d.f.
D.F. • If you’re off on d.f., you will probably miss the rest of the problem. • t-test: n1 + n2 – 2 • Chi squared: n1– 1 • Correlation: n1– 2
t-test: n1 + n2 – 2how many d.f.?Chi squared: n1– 1how many d.f.? Correlation: n1– 2how many d.f.?
t-test: n1 + n2 – 28 d.f.Chi squared: n1– 14 d.f. Correlation: n1– 23 d.f.
How do you know which test to use? • First, practice! • t-test: You’re trying to see if there is a difference between the averages of two data sets. These data sets will always be in the same units. • Chi squared: You’ll be given observed and expected data (in a t-test you will be given two independently collected sets of observed data). Data sets for chi squared will always be in the same units. You will not have to calculate obs and exp, but you will have to tell which is which. • Correlation: You’re testing to see if there is a relationship between two data sets. This is the test for which scatter plots are helpful (but you won’t make any graphs on the test). These data sets will usually be in different units. • No credit will be given for doing the wrong statistical test correctly.
A few more helpful points : • Be familiar with the following functions in Excel: AVERAGE, STDEV, VAR, CORREL, SQRT, TTEST, ^2. • CORREL does not give a p value, TTEST does. • Know the difference between S^2 and S and what these mean. • Which way is significant; greater than or less than 0.05? • In a correlation, a negative significant relationship is a significant relationship. If you get a negative r value, report is as such. Change a negative r to positive before looking it up in the chart. • Know how to use parentheses correctly in an Excel function. • If you get a significant p-value, which do you support; your null or your alternative hypothesis?