Download
1 / 46
500 likes | 853 Views
Learn about spatial, spectral, temporal, and sensor characteristics when choosing satellite imagery, including resolution, sensitivity, program history, and cost considerations. Understand how these factors impact image analysis and interpretation.

E N D
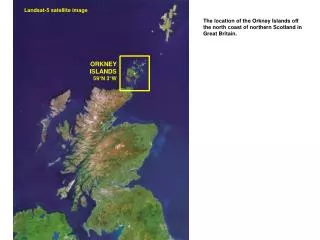
Satellite Image Characteristics What to consider when selecting satellite imagery
Image Characteristics • Spatial resolution • Spectral characteristics • Temporal characteristics • Sensor sensitivity • Program History • Image surface area • Multi-angle capability • Tasking • Price and licensing • Browse options • Processing Options
4 sensor characteristics that affect what can be seen in an image • Spatial resolution • Spectral characteristics • Temporal characteristics • Sensor sensitivity Source: NASA
4 sensor characteristics that affect what can be seen in an image • Spatial resolution • Spectral characteristics • Temporal characteristics • Sensitivity of the sensor
Often called the 4 types of resolution • Spatial resolution • Spectral resolution • Temporal resolution • Radiometric resolution
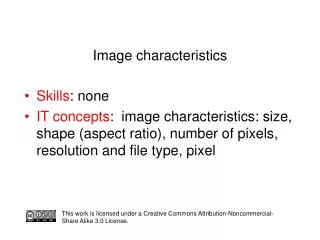
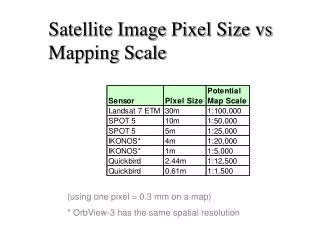
Spatial resolution • Often referred to simply as resolution • Size of an image pixel in ground dimensions • Usually represented by the length of one side of a square (i.e., 30m resolution)
Spatial Resolution Advice • Moving from detection => identification => analysis requires finer resolution • Rule of thumb – select resolution ~1/10th the size of the feature you want to examine • Rule of thumb is not very useful – strongly linked to feature characteristics (contrast, location, shape…) • Get advice from others – experience is invaluable • High contrast between features allows detection of sub-pixel sized features
Spectral characteristics • Bandwidth • Range of wavelengths (colors) detected by a particular band • Band placement • The portion of the electromagnetic spectrum detected by a particular band • Defined by the low and high wavelengths of the range or the by center of the range • Number of bands • The number of bands imaged by the sensor • Often grouped as panchromatic (single band), multispectral (more than one band), or hyperspectral (usually over 100 bands) • Spectral resolution definition is inconsistent and varies to include some or all of the above characteristics
Spectral characteristics for Landsat ETM+ Bandwidth – width of rectangles Band placement – location of the rectangle along the x-axis Number of bands – number of rectangles
Hyperspectral sensors provide more detailed spectral information
Temporal characteristics • The temporal frequency or minimum time a particular feature can be recorded twice • Repeat frequency can be shorter than the overpass frequency of the platform if the sensor is pointable • Just because the satellite is flying over a feature doesn’t mean that feature will be imaged • Short repeat interval increase chances of acquiring a “clean” image • The specific time and date a feature is imaged • Note: Most satellite orbits do not pass over the poles so these data can not always be acquired
Northern Madagascar seasonal change July November
Northeastern Madagascar deforestation 1993 2000
Sensitivity of the sensor • Dynamic range of the sensor • Upper and lower limits of the intensity of the signal (reflected radiation) a sensor can measure • Some sensors have a high and low gain setting • Range of values that can represent the value of a pixel (quantization) • Often defined as the bit depth • Common DN ranges are 0-255 (8-bit) and 0-1023 (10-bit)
8 bits (0-255) 6 bits (0–63) 3 bits (0-7) 1 bit (0-1)
Program History • When the program started • How long the program ran • Will the program continue • Are historic images still available
Image Surface Area • The area on the ground covered by an image is called the footprint • Larger footprint increases chances that your study area falls on fewer images • Larger footprint usually reduces problems associated with mosaicing multiple images (color matching, geometric matching, different seasons…)
Multi-Angle Options • Some sensors are pointable • Improves the ability to target specific areas instead of systematic collection • Can be used to collect stereo pairs for creation of DEMs • Off-angle viewing distorts the image although this is compensated for during processing • Effectively shortens repeat interval
Tasking • Many satellite remote sensing systems can be tasked to acquire imagery on a specific date or time period • Tasking can be expensive • Read the small print of the agreement to understand how “acceptable” (cloud cover, time frame, number of tries…) is defined
Price and Licensing • Image prices range from free to >$100/km2 • Some imagery can be distributed free of charge • Many commercial companies only license their imagery so a user never “owns” the data • Licensing agreements define how the imagery can be used and distributed – read them carefully before you buy
Browse Options • Most image providers have powerful browse capabilities with tutorials • Some systems have historic imagery scattered around the world at ground receiving stations • Regional centers sometimes have browse capabilities for a variety of remotely sensed imagery • Researching available imagery can be time consuming if you are interested in multiple image types
Processing Options • Can be a bit confusing • Most vendors provide a variety of radiometric (adjusting the “colors”) and geometric (adjusting the image so it matches a particular orientation or a specific map projection) options • The simplest processing uses on-board calibration and orbital models • Improved processing involves off-the-shelf ancillary data such as a DEM or user supplied data to improve geometry • With appropriate software, skills, and data users can do their own radiometric and geometric processing • Even with pre-processed imagery a user may have to do additional processing if the imagery is to be combined with other spatial data
Types of satellite imagery • Passive sensors (use sunlight for energy source) • Low resolution (>100 meter resolution) • MODIS, AVHRR, SPOT Vegetation • Moderate resolution (15 – 100 meter resolution) • Landsat TM/ETM+, SPOT, ASTER, IRS • High resolution (<15 meter resolution) • IKONOS, Quickbird, OrbViewIRS, SPOT, Corona • Active sensors (generate their own energy) • Radar • Radarsat, ERS, Envisat, Space Shuttle • Lidar • Mostly airborne platforms for now • ICESat is only satellite lidar platform
MODIS (500m) – Composited using imagery acquired from June – September 2001
Active systems • Active sensors provide their own illumination source whereas passive sensors, such as Landsat, use the sun for illumination. • Radar and lidar are the two most popular active remote sensing systems. • Active sensors can provide direct measurements of vegetation structure. • Currently a lot of research on developing active systems and using active sensors for ecological studies.
LIDAR • LIDAR = LIght Detection And Ranging • Measures the distance between the sensor and a target and strength of return • Wavelengths from the blue through near-infrared are used • Lidar can be deployed as fixed or scanningsystems • Best known for acquiring DEM information • Can be used to measure vegetation height and structure • Measures discrete portions of the returned signal and more sophisticated systems can measure the entire waveform of the returned signal • Most systems are for airborne platforms although NASA’s ICESat is a satellite sensor has been used to measure tree height and other vegetation characteristics.
From: Lefsky, M.A., W.B. Cohen, G.G. Parker and D.J. Harding. 2002. Lidar remote sensing for ecosystem studies. Bioscience 52(1) 19-30.
RADAR • RADAR = RAdio Detection And Ranging • Radar systems measure the strength of the backscatter (portion of energy received by the radar antenna) and the time delay between when the signal was emitted and when it was received • Radio wavelengths are much longer than visible or infrared wavelengths and because of that they are penetrate vegetation canopies and the longer wavelength radar systems can penetrate the soil surface • The way a radar signal interacts with depends on the object’s size, shape, surface roughness, the angle of the incident microwave energy, and dielectric constant • Radar systems can emit and receive vertically and horizontally polarized radio waves • Radar systems are flown on aircraft and satellite • Some microwave systems are passive instruments that measure emitted radio waves. These systems are used to measure soil moisture • Radar is used to map land cover, measure vegetation structure, and create DEMs • Processing and interpreting radar imagery requires special training
What if “traditional” imagery is not available? • Look for less common data sets such as: • Aerial photography • Corona imagery • Airborne imagery • AIRSAR • AVIRIS • Research satellites/sensors • Hyperion • Advanced Land Imager • Astronaut photography • RADAR • LIDAR • Modify analysis methods and/or study area • Modify project objectives
Andros, Bahamas Astronaut photo
Andros, Bahamas Astronaut photo
Landsat Scan Line Correction Error • Broken on May 2003 • Error causes gaps in the images that start at the center and become wider at the edges • Data is still being obtained and sold for $300 per image (half the normal price)
Landsat Scan Line Correction Error • Data offered with “gaps filled” from older data SLC-Off April 2004 Image April 2003 Image SLC-Off “Gap-Filled” Image
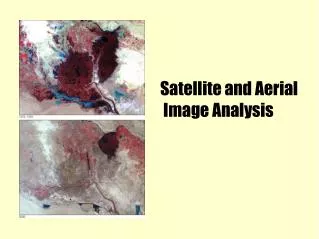
Kruger National Park – Republic of South Africa Landsat ETM+ (left) and ALI (right)
So - How do you decide what to use? • Compare options using tables like the one at: http://homepage.mac.com/alexandreleroux/arsist/ • Image availability and cost are the two primary limiting factors • Easy to get lost in the details – use common sense • Get advice from someone with experience
Sources for data • Global Land Cover Facility (GLCF) • http://landcover.org • USGS EarthExplorer • http://edcsns17.cr.usgs.gov/EarthExplorer/ • USGS Global Visualization Viewer • http://glovis.usgs.gov/ • EROS Data Gateway • http://edcimswww.cr.usgs.gov/pub/imswelcome/plain.html • USGS National Map Seamless Data Distribution System • http://seamless.usgs.gov/ • Astronaut Photography • http://eol.jsc.nasa.gov/default.htm • MrSid GeoCover Landsat TM images • https://zulu.ssc.nasa.gov/mrsid/ • Terraserver • http://terraserver-usa.com • Astronaut Photography • http://eol.jsc.nasa.gov/default.htm • NGA Raster Roam • http://geoengine.nima.mil/geospatial/SW_TOOLS/NIMAMUSE/webinter/rast_roam.html • GeoData.gov • http://www.geodata.gov/gos
More sources for data • Tropical Rain Forest Information Center (TRFIC) • TRIFC - http://bsrsi.msu.edu/trfic/home.html • Landsat.org • Landsat.org - http://www.landsat.org • African Data Dissemination Service • http://edcsnw4.cr.usgs.gov/adds/index.php • Centre for Remote Imaging, Sensing and Processing (CRISP) • http://www.crisp.nus.edu.sg/crisp.html • ESA Earth Observation Earthnet Online • http://earth.esa.int/ • SPOT Vegetation products • http://free.vgt.vito.be/ • Free data for Canada • http://geogratis.cgdi.gc.ca/clf/en • Shuttle Radar Topography Mission (SRTM) • ftp://edcsgs9.cr.usgs.gov/pub/data/srtm/ and GLCF • ASTER Protected Area Archive • http://asterweb.jpl.nasa.gov/APAA/default.htm • Wim Bakker’s list of data directories and inventories • http://www.itc.nl/~bakker/invdir.html