Download
1 / 39
390 likes | 491 Views
Chapter 1: Examining Distributions:. http://anengineersaspect.blogspot.com/2013_05_01_archive.html. What is Statistics?. http://vadlo.com/cartoons.php?id=71. Applications of Statistics. Computer Science client-server performance image processing Chemistry/Physics

E N D
Chapter 1: Examining Distributions: http://anengineersaspect.blogspot.com/2013_05_01_archive.html
What is Statistics? http://vadlo.com/cartoons.php?id=71
Applications of Statistics • Computer Science client-server performance image processing • Chemistry/Physics determining outliers in your data linear regression propagation of error dealing with large populations and approximations • Engineering is one process/technique better than another one? • Business Making good decisions • Everyday life Average cell phone usage of Purdue students
Who? What cases do the data describe? How many cases? What? How many variables? What is the exact definition of each variable? What is the unit of measurement for each variable? Why? What is the purpose of the data? What questions are being asked? Are the variables suitable? To better understand a data set, ask:
Visual Displays: Bar Graph The following is a bar graph of the final grade of STAT 350 which I taught last Spring.
Visual Displays: Histogram 100 married couples between 30 and 40 years of age are studied to see how many children each couple have. The table below is the frequency table of this data set.
Visual Display: Continuous Histogram Power companies need information about customer usage to obtain accurate forecasts of demand. Investigators from Wisconsin Power and Light determined the energy consumption (BTUs) during a particular period for a sample of 90 gas-heated homes. An adjusted consumption value was calculated via The data is listed under furnace.txt under extra files on the computer web page.
Example (cont) 63 classes Bin = 0.5 32 classes Bin = 0.25 Bin = 1 17 classes Bin = 3 7 classes Bin = 5 4 classes
Shapes of Histograms Symmetric unimodal bimodal multimodal http://www.particleandfibretoxicology.com/content/6/1/6/figure/F1?highres=y
Shapes of Histograms (cont) Symmetric Positively skewed Negatively skewed
Example: Time Plots We are interested in the temperature (oF) of effluent at a sewage treatment plant. • Plot a histogram of the data. • Plot a time plot of the data.
Sample Mean: Example The following data give the time in months from hire to promotion to manager for a random sample of 20 software engineers from all software engineers employed by a large telecommunications firm. a) What is the mean time for this sample? b) Suppose that instead of x20 = 69, we had chosen another engineer that took 483 months to be promoted. what is the mean time for this new sample?
Sample Median: Example The following data give the time in months from hire to promotion to manager for a random sample of 20 software engineers from all software engineers employed by a large telecommunications firm. a) What is the median time for this sample? b) Suppose that instead of x20 = 69, we had chosen another engineer that took 483 months to be promoted. what is the median time for this new sample?
Mean and Median Mean Median Left skew Right skew Mean Median Mean Median
Quartiles Q1 Q2 Q3
Quartiles: Example The following data give the time in months from hire to promotion to manager for a random sample of 19software engineers from all software engineers employed by a large telecommunications firm. • Find the median and the quartiles. • What is the Interquartile Range? • Are there any outliers in this data set?
Sample Standard Deviation: Example The following data give the time in months from hire to promotion to manager for a random sample of 20 software engineers from all software engineers employed by a large telecommunications firm. What is the standard deviation time for this sample?
Density Function (b) (a) (c)
Properties of Density Curve y = f(x) y = f(x)
Mean http://isc.temple.edu/economics/notes/descprob/descprob.htm
Example: mean and median A person casually walks to the bus stop when the bus comes every 30 minutes has a density function of • What is the proportion of people that have to wait between 5 and 10 minutes? • What is the median of people who wait? • What is the mean of people who wait?
Uniform: density function http://www.six-sigma-material.com/Uniform-Distribution.html
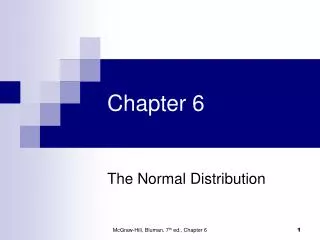
Shapes of Normal Density Curve http://resources.esri.com/help/9.3/arcgisdesktop/com/gp_toolref /process_simulations_sensitivity_analysis_and_error_analysis_modeling /distributions_for_assigning_random_values.htm
Using the Z table area right of z= 1 area left of z area between z1 and z2= area left of z1 – area left of z2
Normal Distribution: Example A particular rash has shown up in an elementary school. It has been determined that the length of time that the rash will last is normally distributed with mean 6 days and standard deviation 1.5 days. • What is the percentage of students that have the rash for longer than 8 days? • What is the percentage of students that the rash will last between 3.7 and 8 days?
Normal Distribution: Example A particular rash has shown up in an elementary school. It has been determined that the length of time that the rash will last is normally distributed with mean 6 days and standard deviation 1.5 days. • How long would the student’s rash have to have lasted to be in the top 10% of the number of days that the students have the rash?
Normal Distribution: Example A particular rash has shown up in an elementary school. It has been determined that the length of time that the rash will last is normally distributed with mean 6 days and standard deviation 1.5 days. • What interval symmetrically placed about the mean will capture 95% of the times for the student’s rashes to have lasted.
Procedure: Normal Quantile Plot • Arrange the data from smallest to largest. • Record the corresponding percentiles (quantiles). • Find the z value corresponding to the quantile calculated in part 2. • Plot the original data points (from 1) vs. the z values (from 3).