Download
1 / 2
30 likes | 523 Views
Influence of mid-latitude cyclones on trace gas transport from North America to the western North Atlantic Ocean O. R. Cooper and J. L. Moody Department of Environmental Sciences, University of Virginia, Charlottesville

E N D
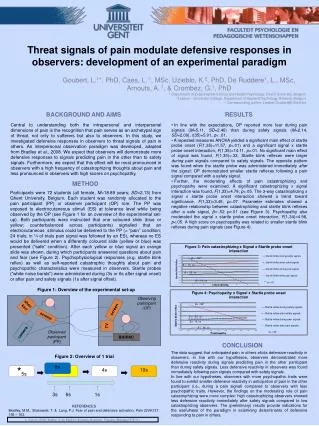
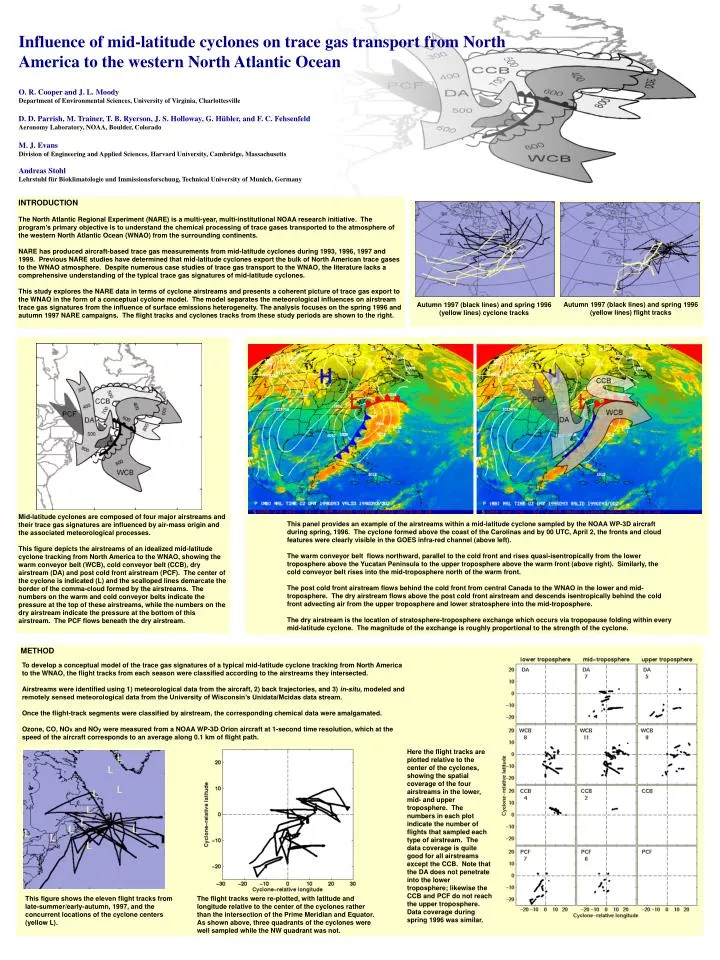
Influence of mid-latitude cyclones on trace gas transport from North America to the western North Atlantic Ocean O. R. Cooper and J. L. Moody Department of Environmental Sciences, University of Virginia, Charlottesville D. D. Parrish, M. Trainer, T. B. Ryerson, J. S. Holloway, G. Hübler, and F. C. Fehsenfeld Aeronomy Laboratory, NOAA, Boulder, Colorado M. J. Evans Division of Engineering and Applied Sciences, Harvard University, Cambridge, Massachusetts Andreas Stohl Lehrstuhl für Bioklimatologie und Immissionsforschung, Technical University of Munich, Germany INTRODUCTION The North Atlantic Regional Experiment (NARE) is a multi-year, multi-institutional NOAA research initiative. The program’s primary objective is to understand the chemical processing of trace gases transported to the atmosphere of the western North Atlantic Ocean (WNAO) from the surrounding continents. NARE has produced aircraft-based trace gas measurements from mid-latitude cyclones during 1993, 1996, 1997 and 1999. Previous NARE studies have determined that mid-latitude cyclones export the bulk of North American trace gases to the WNAO atmosphere. Despite numerous case studies of trace gas transport to the WNAO, the literature lacks a comprehensive understanding of the typical trace gas signatures of mid-latitude cyclones. This study explores the NARE data in terms of cyclone airstreams and presents a coherent picture of trace gas export to the WNAO in the form of a conceptual cyclone model. The model separates the meteorological influences on airstream trace gas signatures from the influence of surface emissions heterogeneity. The analysis focuses on the spring 1996 and autumn 1997 NARE campaigns. The flight tracks and cyclones tracks from these study periods are shown to the right. Autumn 1997 (black lines) and spring 1996 (yellow lines) flight tracks Autumn 1997 (black lines) and spring 1996 (yellow lines) cyclone tracks Mid-latitude cyclones are composed of four major airstreams and their trace gas signatures are influenced by air-mass origin and the associated meteorological processes. This figure depicts the airstreams of an idealized mid-latitude cyclone tracking from North America to the WNAO, showing the warm conveyor belt (WCB), cold conveyor belt (CCB), dry airstream (DA) and post cold front airstream (PCF). The center of the cyclone is indicated (L) and the scalloped lines demarcate the border of the comma-cloud formed by the airstreams. The numbers on the warm and cold conveyor belts indicate the pressure at the top of these airstreams, while the numbers on the dry airstream indicate the pressure at the bottom of this airstream. The PCF flows beneath the dry airstream. This panel provides an example of the airstreams within a mid-latitude cyclone sampled by the NOAA WP-3D aircraft during spring, 1996. The cyclone formed above the coast of the Carolinas and by 00 UTC, April 2, the fronts and cloud features were clearly visible in the GOES infra-red channel (above left). The warm conveyor belt flows northward, parallel to the cold front and rises quasi-isentropically from the lower troposphere above the Yucatan Peninsula to the upper troposphere above the warm front (above right). Similarly, the cold conveyor belt rises into the mid-troposphere north of the warm front. The post cold front airstream flows behind the cold front from central Canada to the WNAO in the lower and mid-troposphere. The dry airstream flows above the post cold front airstream and descends isentropically behind the cold front advecting air from the upper troposphere and lower stratosphere into the mid-troposphere. The dry airstream is the location of stratosphere-troposphere exchange which occurs via tropopause folding within every mid-latitude cyclone. The magnitude of the exchange is roughly proportional to the strength of the cyclone. METHOD To develop a conceptual model of the trace gas signatures of a typical mid-latitude cyclone tracking from North America to the WNAO, the flight tracks from each season were classified according to the airstreams they intersected. Airstreams were identified using 1) meteorological data from the aircraft, 2) back trajectories, and 3) in-situ, modeled and remotely sensed meteorological data from the University of Wisconsin’s Unidata/Mcidas data stream. Once the flight-track segments were classified by airstream, the corresponding chemical data were amalgamated. Ozone, CO, NOx and NOy were measured from a NOAA WP-3D Orion aircraft at 1-second time resolution, which at the speed of the aircraft corresponds to an average along 0.1 km of flight path. Here the flight tracks are plotted relative to the center of the cyclones, showing the spatial coverage of the four airstreams in the lower, mid- and upper troposphere. The numbers in each plot indicate the number of flights that sampled each type of airstream. The data coverage is quite good for all airstreams except the CCB. Note that the DA does not penetrate into the lower troposphere; likewise the CCB and PCF do not reach the upper troposphere. Data coverage during spring 1996 was similar. This figure shows the eleven flight tracks from late-summer/early-autumn, 1997, and the concurrent locations of the cyclone centers (yellow L). The flight tracks were re-plotted, with latitude and longitude relative to the center of the cyclones rather than the intersection of the Prime Meridian and Equator. As shown above, three quadrants of the cyclones were well sampled while the NW quadrant was not.
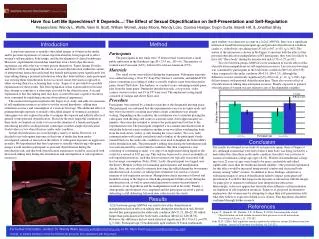
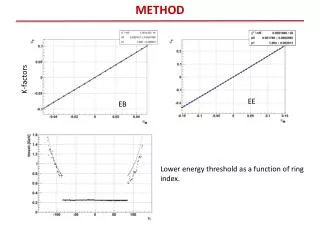
RESULTS Data from: Olivier, J. G. J, J. P. J. Bloos, J. J. M. Berdowski, A. J. H. Visschedijk and A. F. Bouwman, A 1990 global emission inventory of anthropogenic sources of carbon monoxide on 1° x 1° developed in the framework of EDGAR/GEIA, Chemosphere: Global Change Science, 1, 1-17, 1999. Surface emissions heterogeneity has a strong impact on the quantity of anthropogenic emissions that enter cyclone airstreams. This map shows the annual CO emissions from all anthropogenic sources in North America. Clearly, cyclone airstreams that draw from the eastern United States will contain greater levels of emissions than those that draw from northern Canada. These panels show the paths most commonly traversed by the airstreams sampled over the WNAO during late-summer/early-autumn 1997, with warmer colors indicating regions of greater influence. The WCB had a strong influence from continental and marine regions, while the CCB and PCF were mainly influenced by the continent. Similarly, these panels show the airstream paths during spring, 1996. Not only does the WCB have a stronger continental influence during spring, but the WCB, CCB and PCF have a stronger influence from the high emissions regions of the USA. The more southerly cyclone tracks in spring account for nearly 50% of the increase of lower troposphere CO from autumn to spring. C Median ozone mixing ratios These figures convey the typical structure and location of mid-latitude cyclones tracking from N. America to the WNAO, and also show the median O3 and CO mixing ratios. O3 is greater in spring due to a stronger influence from the stratosphere, the longer lifetime of ozone during the previous winter months and springtime photochemistry. CO is greater in spring due to reduced destruction by the OH radical during winter. In both seasons the PCF has the smallest O3 mixing ratios in the lower troposphere due to transport from central Canada. But the greatest ozone mixing ratios are found immediately above in the DA, the result of stratosphere/troposphere exchange. In both seasons the greatest O3 mixing ratios in the lower troposphere are found in the WCB. The WCB forms on the western side of surface anticyclones where warm and stagnant conditions favor photochemical ozone production. In addition, the western sides of surface anticyclones are the most likely regions for stratospheric ozone to eventually mix down to the surface. The CCB has the greatest CO mixing ratios in the lower troposphere but the meteorology is not as favorable for photochemical O3 production. The +/- symbols indicate the airstreams with significant O3/CO slopes. Median CO mixing ratios D A WCB CCB PCF D A WCB CCB PCF D A WCB CCB PCF Autumn 1997: Distributions of relative humidity, O3, CO, NOy, and the NOx/NOy ratio in the lower, mid- and upper troposphere for each airstream. The data are expressed as percentiles: 50th percentile (+), 25th and 75th percentiles (open circles), 5th and 95th percentiles (squares), and the minimum and maximum values (solid circles). The mean (horizontal line) plus or minus the standard deviation (shaded bar) is also shown. Ozone has the greatest variation between airstreams, while relatively little NOy is transported out of the lower troposphere. Spring 1996 O3 vs. CO for all four airstreams. The lighter (darker) shading corresponds to relatively higher (lower) data density. The range of the autumn 1997 data for each airstream is outlined in red. Linear regression lines for each airstream are shown for spring 1996 (gray lines) and autumn 1997 (red dashed lines) with the slope and r2 values in black (spring) and red (autumn). O3 and CO background mixing ratios are shown for spring (blue dot) and autumn (red dot). Autumn photochemical O3 production occurs in the lower troposphere PCF and all levels of the WCB. Significant springtime photochemical O3 production is not evident in any airstream, with the lower troposphere CCB associated with O3 destruction. The negative DA slopes are the result of stratosphere/troposphere exchange. CONCLUSIONS Mid-latitude cyclone airstreams govern the transport of trace gases to the WNAO. Composite cyclones for other regions would undoubtedly show similar results. An airstream's source region has a strong influence on the mean or median mixing ratios of its constituent trace gases. However, the ozone/CO slopes and ozone/NOy slopes for a particular airstream remain constant in a given season, regardless of air mass origin. Stratosphere/troposphere exchange occurs in every dry airstream of every cyclone, the intensity proportional to the strength of the cyclone. However, the seasonal cycle of ozone in the lowermost stratosphere allows greater quantities of ozone to enter the troposphere during spring. The more southerly cyclone tracks that occur in spring account for nearly 50% of the observed increase of lower troposphere CO from autumn to spring. The remainder of the variation is due to the seasonal CO cycle. Wet deposition of the water soluble constituents of NOy occurs in the warm conveyor belt and cold conveyor belt but not in the post cold front airstream or the dry airstream. During autumn photochemical ozone production is evident in the warm conveyor belt at all levels and in the lower troposphere post cold front airstream. During spring net ozone production appears absent from all airstreams, with the cold conveyor belt influenced by ozone destruction. Ozone and CO are greater in spring but the relative mixing ratios between airstreams are roughly the same in spring and autumn. NOx/CO emissions ratios vary across the mid-latitudes according to socio-economic factors. It is expected that the emissions variation influences the ozone production efficiency of the cyclone airstreams that draw from these regions. This conceptual cyclone model has established the fundamental relationships between synoptic/regional-scale chemical transport and mid-latitude cyclone structure. These results can provide critical tests for the output of those chemical transport models with the ability to resolve the structure of cyclone airstreams. This study has focused on spring and early autumn data above the WNAO, the two seasons that roughly coincide with the seasonal maximum and minimum of tropospheric background O3 and CO. However neither season contained a pollution episode comparable to those that occur during summer over the eastern USA. To illustrate the differences and similarities between the conceptual cyclone model and such an episode we compare the present results to a NARE flight on August 28, 1993 . Autumn 1997 WCB Spring 1996 WCB Autumn 1997 DA Autumn 1997 WCB Autumn 1997 DA Autumn 1997 WCB Data from all flight altitudes on August 28, 1993 are shown (gray dots) with data in the lower, mid- and upper troposphere highlighted (yellow dots). The August 28 data in the lower troposphere are far greater than anything measured in spring or autumn but they still fall along the slope of the early-autumn WCB, indicating that the slope is a better trace gas signature than mean or median mixing ratios. The high O3 mixing ratios measured in the upper troposphere fall within the domain of the autumn DA, supporting the meteorological observations that this air mass partially originated in the stratosphere. The flight (white line) occurred in the warm sector of a cyclone just ahead of the WCB (green arrow). In the lower troposphere the aircraft intersected an air mass that had stagnated over the eastern USA for two days (red trajectory). In the upper troposphere the aircraft intersected a remnant of the DA from the previous cyclone (blue trajectory). Funding for this research was provided by NOAA Award Nos. NA96GPO409 and NA76GPO310 to the University of Virginia. Real-time meteorological data provided by UNIDATA internet delivery and displayed using McIDAS software.