Download
1 / 9
90 likes | 285 Views
Total Quality Management (TQM) utilizes various tools like Pareto Principle, Control Charts, and Fishbone Diagram to identify causes of problems and enhance organizational processes. Introduced by Kaoru Ishikawa, this diagram aids in analyzing and solving issues effectively.

E N D
Cause and Effect , Fishbone, Ishikawa Diagram Be water my friend
Cause and Effect , Fishbone, Ishikawa Diagram • Total Quality Management (TQM) is a management strategy created to achieve excellence in quality in all organizational processes. TQM has been widely used in manufacturing, education, government, and service industries, as well as NASA space and science programs.
TQM ToolsHere follows the basic set of Total Quality Management tools: • Pareto Principle • Scatter Plots • Control Charts • Flow Charts • Cause and Effect , Fishbone, Ishikawa Diagram • Histogram or Bar Graph • Check Lists • Check Sheets
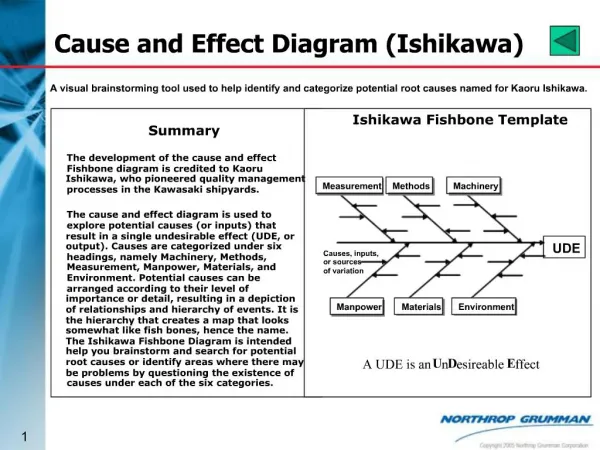
Cause and Effect , Fishbone, Ishikawa Diagram • The creator was Kaoru Ishikawa, who pioneered quality management processes in the Kawasaki shipyards, and in the process became one of the founding fathers of modern management. • It is simply a diagram that shows the causes of a certain event. • It was first used in the 1960s.
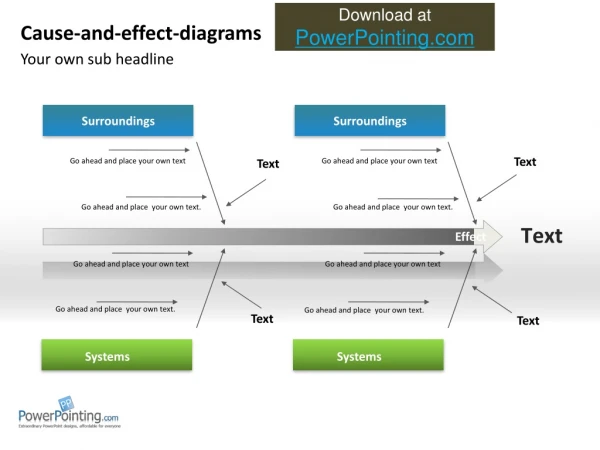
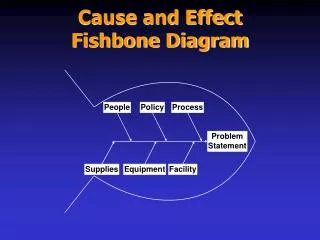
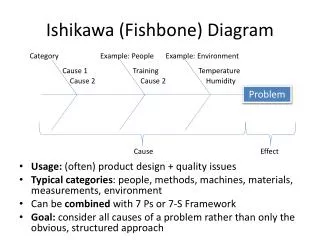
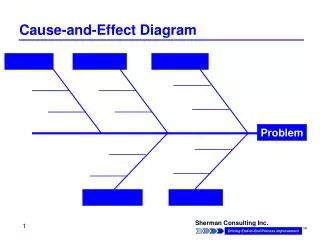
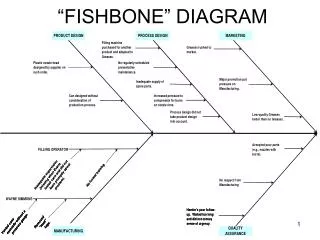
Cause and Effect , Fishbone, Ishikawa Diagram • This is a useful tool to identify the causes of a problem. It’s called Fishbone because of the resemble of the diagram with a fishbone, where the identified causes converge to a main branch, that leads to the result, or effect, which is the problem to solve.
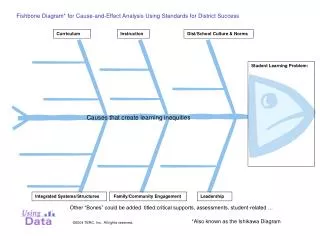
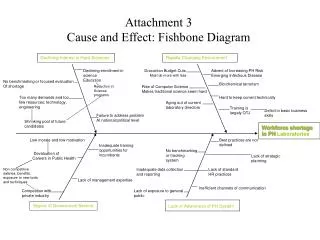
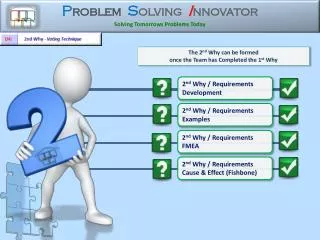
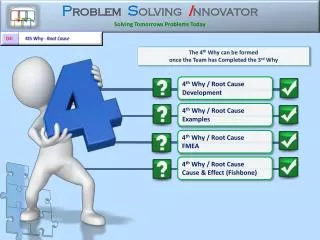
Cause and Effect , Fishbone, Ishikawa Diagram • To complete an Ishikawa fishbone diagram or cause and effect diagram: • Put the problem statement in the head of the fish and the major causes at the end of the major bones. Major causes include: • Processes, machines, materials, measurement, people, environment • Steps of a process (step 1, step 2, etc.). • Whatever makes sense • Begin with the most likely main cause. • For each cause, ask "Why?" up to five times.
Cause and Effect , Fishbone, Ishikawa Diagram • This tool is specially efficient for capturing team brainstorming output and for attacking a problem from the “wide picture”. A fishbone diagram can become very complex, as the one shown in the next sheet.