1 / 2

Fishbone Diagram

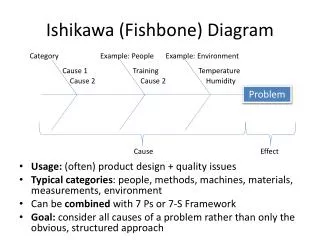
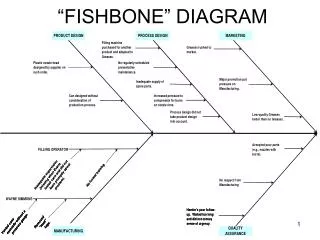
Fishbone Diagram. 10/20/11 Ashton Pepple Kyler Sanders. Factors contributing to low test scores:. Environment. Personal life. Student. Study Noise Distractions Focus Students Work

naiya
Download Presentation

Fishbone Diagram

An Image/Link below is provided (as is) to download presentation Download Policy: Content on the Website is provided to you AS IS for your information and personal use and may not be sold / licensed / shared on other websites without getting consent from its author. Content is provided to you AS IS for your information and personal use only. Download presentation by click this link. While downloading, if for some reason you are not able to download a presentation, the publisher may have deleted the file from their server. During download, if you can't get a presentation, the file might be deleted by the publisher.

E N D

Presentation Transcript


  1. Fishbone Diagram 10/20/11 Ashton Pepple Kyler Sanders

  2. Factors contributing to low test scores: Environment Personal life Student Study Noise Distractions Focus Students Work Understanding Classes Family Methods Test Learning Knowledge Study Difficult Attention Day/week Coverage Teacher Time Material

More Related