Download
1 / 20
850 likes | 2.5k Views
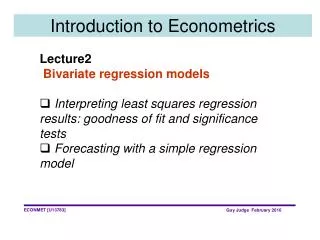
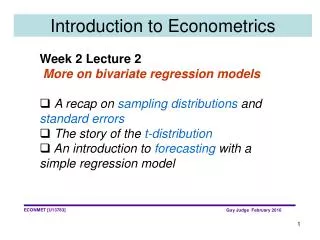
Introduction to Econometrics. Lecture 1 Introduction and overview of the course Definition, scope and methodology of econometrics A review of the simple (bivariate) linear regression model. Objectives. To provide you with information about

E N D
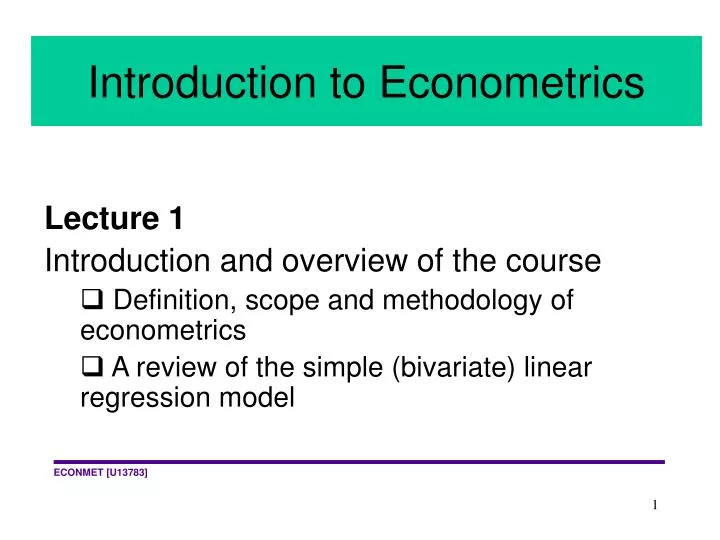
Introduction to Econometrics Lecture 1 Introduction and overview of the course Definition, scope and methodology of econometrics A review of the simple (bivariate) linear regression model
Objectives To provide you with information about the subject of econometrics and the topics that we shall cover in the unit the learning teaching and assessment arrangements for the unit To review the simple bivariate linear regression model
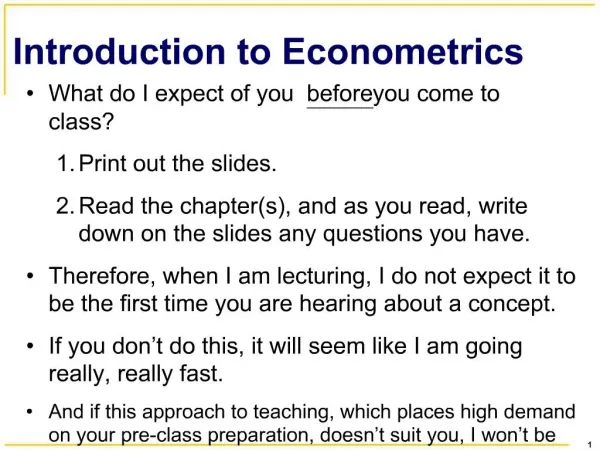
Learning and Teaching Lectures and accompanying notes Problems classes (seminars) Computer lab sessions Office hours and “econometrics café” sessions Text books Web pages and links the econmet wiki One minute e-mail and FAQs
Recommended texts Dougherty, C (2007) Introduction to Econometrics, Third Edition, OUP Gujarati, D N and Porter, DC (2009) Basic Econometrics, Fifth Edition, McGraw-Hill Kennedy, P (2003) A Guide to Econometrics, Fifth Edition, Blackwell Koop, G (2008) Introduction to Econometrics, John Wiley & Sons and others available in the Library in section 330.0182
Computer software for the lab classes The regression tool in Excel PcGive EViews
assessment end of unit exam (50% weighting) portfolio of practical solutions (20% weighting) assignment/report (30% weighting)
econometrics The measurement of economic relationships
econometrics “the application of mathematical statistics to economic data to lend empirical support to models constructed by mathematical economics and to obtain numerical estimates” (Samuelson et al., Econometrica, 1954)
aims of econometric modelling explanation policy evaluation forecasting
types of data cross-section time-series panel
types of model simple bivariate linear non-linear bivariate multiple regression dynamic simultaneous equation other (e.g. logit and probit) panel
Example: sales-advertising relationship suppose we wish to test the hypothesis that a firm’s sales are dependent upon it’s advertising the simplest model is sales = a + b*advertising + u where a and b are parameters to be estimated, u is an unobservable error term - a random disturbance this is an example of a simple bivariate regression model
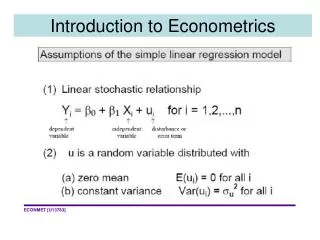
general notation for the simple bivariate linear model for i = 1,2,…….n With time series data we tend use t rather than i as the subscript and T as the sample size
model specification the equation(s) – variables and functional form a priori restrictions on parameters stochastic assumptions (assumptions about the disturbance term)
assumptions about u mean zero constant variance independent between observations independent of the X variable
The role of the disturbance term Reasons for the disturbance omitted influences on Y errors of measurement errors in variables non-linearity random nature of human behaviour
Econometric “problems” Reasons for the disturbance autocorrelation heteroskedasticity bias multicollinearity
Plant X Y FITTED Y 1 100 40 42.32 2 200 50 48.21 3 300 50 54.11 4 400 70 60.00 5 500 65 65.89 6 600 65 71.79 7 700 80 77.68 The unlikely case of control over sample design