Download
1 / 10
100 likes | 318 Views
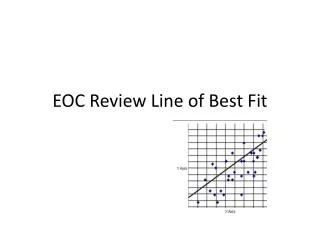
Line of Best Fit. Work with your group to make a prediction for the height at: • 21 months • 28 months • 20 years. Line of Best Fit. Definition - A Line of Best is a straight line on a Scatterplot that comes closest to all of the dots on the graph.

E N D
Work with your group to make a prediction for the height at: • 21 months • 28 months • 20 years
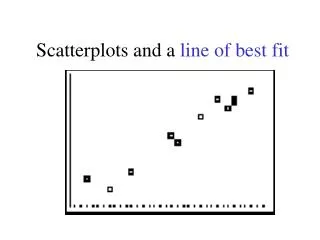
Line of Best Fit • Definition - A Line of Best is a straight line on a Scatterplot that comes closest to all of the dots on the graph. • A Line of Best Fit does not touch all of the dots. • A Line of Best Fit is useful because it allows us to: • Understand the type and strength of the relationship between two sets of data • Predict missing Y values for given X values, or missing X values for given Y values
Equation For Line of Best Fit y = 0.6618x + 64.399 78.3 82.9 223.3
Predicting Data with Scatterplots • Interpretation - Making a prediction for an unknown Y value based on a given X value within a range of known data • Extrapolation - Making a prediction for an unknown Y value based on a given X value outside of a range of known data • More accurate: Interpretation • Less accurate: Extrapolation