Download
1 / 23
250 likes | 405 Views
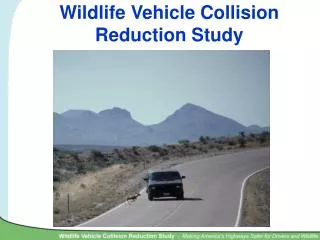
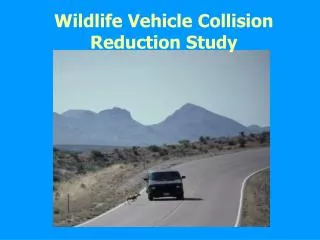
Wildlife Vehicle Collision Reduction Study. Why This Study. Study Results. Crash Data Impacts of Crashes Cost of Crashes Minimization Measures What’s Next. Crash Data. Total WVCs and Total Crashes by Year. (Data Source: GES). Annual WVCs Estimated by Insurance Industry.

E N D
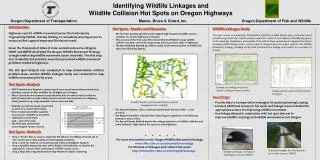
Why This Study
Study Results • Crash Data • Impacts of Crashes • Cost of Crashes • Minimization Measures • What’s Next
Total WVCs and Total Crashes by Year (Data Source: GES)
Monthly Distribution of WVCs 0.25 FARS HSIS GES 0.2 0.15 Proportion of Collisions 0.1 0.05 0 JAN FEB APR MAY JUN JUL AUG SEP OCT NOV MAR DEC
GES 0.12 Time-of-Day Distribution HSIS FARS 0.1 0.08 Proportion of Collisions 0.06 0.04 0.02 0 0 1 5 20 2 3 4 6 7 8 9 10 11 12 13 14 15 16 17 18 19 21 22 23 Hour of Day
WVCs by Number of Lanes 100% WVC ALL 80% Percent of Accidents 60% 40% 20% 0% 2 1 3 4 5 6 7 Number of Lanes
WVC ALL Crashes by Average Daily Traffic 0.7 0.6 0.5 0.4 Proportion of Collisions 0.3 0.2 0.1 0 1 to 5001- 10,001- 15,001- 20,001- 25,001- 30,001- >35,000 5000 15,000 20,000 25,000 30,000 35,000 10,000 ADT
Age Distribution for All Crashes and WVCs 0.5 0.4 All WVC 0.3 Proportion of Collisions 0.2 0.1 0 41 51 1 11 21 31 61 71 81 91 Driver Age
0.6 Accident Distribution by Posted Speed Limit ALL 0.5 WVC 0.4 0.3 Proportion of Accidents 0.2 0.1 0 5 15 20 25 30 40 50 60 70 75 10 35 45 55 65 Speed Limit
Costs Of Crashes
Estimated Costs of WVC (Deer, Elk, and Moose) Up to $8 billion annually. Injury, property damage, crash scene response and investigation.
Severity of Injury Distribution for WVCs vs. All Crashes All Collisions WVCs Only 0.5% 0.5% 1.7% 4.3% 0.04% 2.3% 9.4% None None Possible Possible 17.6% Minor Minor Severe Severe Fatal Fatal 68.3% 95.4%
Minimization Measures for Reducing WVCs
Long Tunnels and Long Bridges 100% effective in WVC reductions, but very expensive
Wildlife Fencing 80-99% reported reductions in WVCs Wildlife fencing along US Hwy. 93 on Flathead Indian Reservation, MT
Wildlife Crossing with Fencing 87%average reduction in WVCs
Promising Mitigation Measures to be Further Investigated 2 Most Promising Animal detection Systems Reduce speed by traffic calming or reducing the design speed
Measures For Which Research or Construction Resources Should Not Be Used • Standard wildlife warning signs • Deer reflectors and mirrors • Audio signals in the right-of-way or deer whistles on vehicles • Olfactory repellants • Deer flagging models • Hazing • Intercept feeding • Wildlife relocation in order to reduce population size • Anti-fertility treatment in order to reduce population size • Seasonal road closures • Reflective collars placed on wildlife
What’s Next WVC training manual WVC training course