Download
1 / 18
180 likes | 248 Views
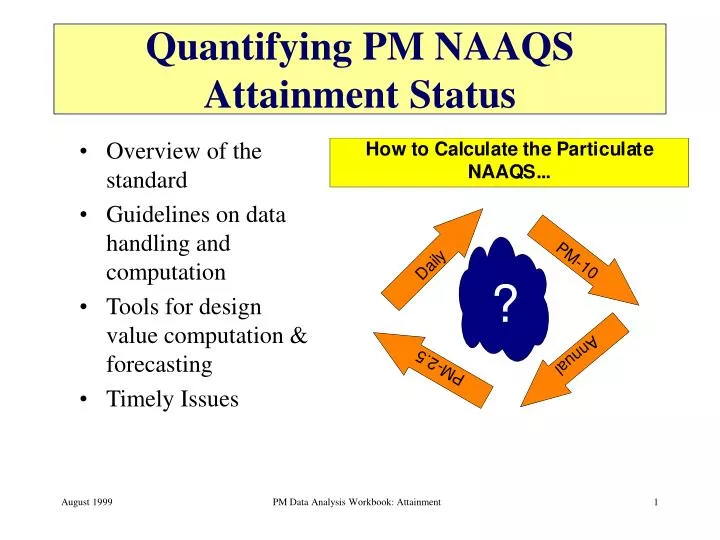
Quantifying PM NAAQS Attainment Status. Overview of the standard Guidelines on data handling and computation Tools for design value computation & forecasting Timely Issues. Overview of the Standard.

E N D
Quantifying PM NAAQS Attainment Status • Overview of the standard • Guidelines on data handling and computation • Tools for design value computation & forecasting • Timely Issues PM Data Analysis Workbook: Attainment
Overview of the Standard • New National Ambient Air Quality Standards (NAAQS) were promulgated for particulate matter (PM) in 1997. [Three new standards were enacted and one existing standard was retained.] • The standards for PM are based on two indicators: PM10 and PM2.5 • Each measurement has an annual standard and a daily standard. PM Data Analysis Workbook: Attainment
Forms of the Standards • Annual • The annual standards are based on arithmetic averages. First, derive quarterly averages; then compute an annual average from the four quarterly averages. • There is also an option to use a network-derived spatial mean for PM2.5. • Daily • Daily standards are based on a percentile of a year’s worth of daily values. • The percentiles are 99th for PM10 and 98th for PM2.5. • Both • Daily and annual standards are averaged over three years. PM Data Analysis Workbook: Attainment
Guidelines on Data Handling and Computation • Daily Standards: • Calculations • Rounding • Data Completeness • Annual Standards: • Calculations • Rounding • Data Completeness PM Data Analysis Workbook: Attainment
Daily Standards - Calculations (page 1 of 2) • Sort the Data • For one year of measured data at one site, sort the data from lowest to highest. • n = number of valid measurements for the year. • Calculate which sorted value is the percentile • I = int(n * P) + 1 • where P is the percentile expressed as a fraction (e.g., 0.99 for PM10 and 0.98 for PM2.5), and “int” is the integer part of the product of P and n. • See the “Fact sheet on PM data handling” under technical fact sheets at http://ttnwww.rtpnc.epa.gov/naaqsfin/fs122398.htm PM Data Analysis Workbook: Attainment
Daily Standards - Calculations (page 2 of 2) Look-up table for determining the 98th or 99th percentile. • The first line of the table is representative of sampling every 6th day and 75% data completeness. • The second line of the table is representative of a) sampling every 6th day achieving 85% to 100% data completeness and b) sampling every third day achieving 75% to 80% data completeness. • The third line of the table is representative of sampling every third day achieving 81% to 100% data completeness. where: samples = number of monitored daily PM values in a year nth Max for the 98th percentile = the nth highest value in a year that represents the 98th percentile (1 is the highest value measured in a year, 2 is the second highest value, etc.) nth Max for the 99th percentile = the nth highest value in a year that represents the 99th percentile PM Data Analysis Workbook: Attainment
Daily Standards - Rounding the 3-Year Average • PM10 values are rounded to the nearest 10 • 155 g/m3 rounds to 160 g/m3 (a violation) • 154 g/m3 rounds to 150 g/m3 (non-violation) • PM2.5 values are rounded to the nearest 1 • 65.5 g/m3 rounds to 66 g/m3 (a violation) • 65.4 g/m3 rounds to 65 g/m3 (non-violation) PM Data Analysis Workbook: Attainment
Daily Standards - Data Completeness • To demonstrate attainment, 75% of all scheduled samples in each quarter must be collected and valid. The definition of “scheduled” is whatever schedule fulfills regulations in part 58 (monitoring). • To demonstrate non-attainment, all values at or below the 98th percentile (for PM2.5) or the 99th percentile (for PM10) must be below the standard (i.e., if any value in the three years is above the appropriate percentile, non-attainment is achieved). PM Data Analysis Workbook: Attainment
Daily Standards - Example A PM2.5 site, daily sampling with 281, 304, and 296 samples in Year 1, Year 2, and Year 3, respectively. • Using either the formula or table: the 98th percentile = the 276th value for Year 1, the 298th value for Year 2, and the 291st value for Year 3. • The 3-year average is the mean of 62.0, 63.0, and 68.4 g/m3 (64.467, rounded is 64) which is less than the standard of 65 g/m3. • Note that ranks are the opposite of an nth maximum (i.e., the first maximum would have the largest rank). Also, only round your data just before comparing to the level of the standard. PM Data Analysis Workbook: Attainment
Annual Standards - Calculations • Steps for Non-Spatial Annual Arithmetic Mean • Calculate quarterly means. • Calculate annual means from quarterly means. • Calculate 3-year means from annual means. • Steps for Spatial Annual Arithmetic Mean • Select sites to be used • Calculate quarterly means. • Calculate annual means from quarterly means. • Calculate spatial annual means for each year. • Calculate 3-year means from spatial annual means. PM Data Analysis Workbook: Attainment
Annual Standards - Rounding the 3-Year Average • PM10 values are rounded to the nearest 1 • 50.5 g/m3 rounds to 51 g/m3 (a violation) • 50.4 g/m3 rounds to 50 g/m3 (non-violation) • PM2.5 values are rounded to nearest 0.1 • 15.05 g/m3 rounds to 15.1 g/m3 (a violation) • 15.04 g/m3 rounds to 15.0 g/m3 (non-violation) PM Data Analysis Workbook: Attainment
Annual Standards - Data Completeness • To demonstrate attainment, 75% of all scheduled samples in each quarter are required. • To demonstrate non-attainment, at least 11 samples in a quarter are required. • Annual means are included in a spatial mean for a single year if they meet the data completeness requirements for that year. • For spatial means, annual means from sites meeting either of the above criteria are included in the spatial mean. PM Data Analysis Workbook: Attainment
Annual Standards - Example 1 • The 3-year mean PM2.5 concentration = 65.94 g/m3 for a PM10 site with annual means of 52.42, 82.17, and 63.23 g/m3 calculated from quarterly means. • This value rounds to 66 g/m3 which is greater than the level of the annual standard (50 g/m3). PM Data Analysis Workbook: Attainment
Annual Standards - Example 2 A PM2.5 network with annual means calculated from quarterly means • Annual means are averaged across sites (spatial mean) before averaging across years. • This calculation assumes the site with 38% data completeness (Site 3, year 2) had less than 11 samples in each quarter. Thus, the 15.2 g/m3 annual mean was left out of the spatial mean calculation. • If we also assume that the site with 50% data completeness (Site 4, year 4) resulted in all quarters with at least 11 samples, then the 16.9 g/m3 annual mean at that site is included in the spatial mean. • The 3-year mean rounds to 14.4 g/m3 which is less than the level of the standard of 15.0 g/m3. PM Data Analysis Workbook: Attainment
Tools for Design Value Computation and Forecasting • AIRS AQS • AMDAS is a PC-based, user-friendly, menu driven program that provides air quality analysts and managers with easy point and click access to air quality data for browsing, preparing tabular and graphical summaries, and performing statistical analyses. AMDAS can be used to analyze meteorological data, routine air quality data (i.e., hourly ozone, oxides of nitrogen, carbon monoxide, etc.), and atmospheric particulate matter data, including PM10 and PM2.5 total mass and speciated sample data. • Other EPA Tools PM Data Analysis Workbook: Attainment
Timely Issues • Exceptional events - unusual conditions that may cause or contribute to air quality violations • Spatial Network Issues • Attainment Design PM Data Analysis Workbook: Attainment
Exceptional Events • In some situations, natural sources strongly influence an area's PM air quality. To avoid imposing potentially unreasonable State implementation plan (SIP) requirements on such areas, EPA provided for the exclusion of certain natural source data from nonattainment determinations. Thus, Appendix K provides, in part, that measured exceedances of the PM-10 NAAQS in an area may be discounted from decisions regarding nonattainment status if the data are shown to be influenced by uncontrollable events caused by natural sources of particulate matter. • Natural events that have been shown to affect the PM10 NAAQS include volcanic and seismic activity, wildland fires, high wind events, structural fires, chemical spills, industrial accidents, and clean-up activities following a major disaster. • Data from exceptional events are not used when making regulatory decisions. The data may be considered valid (i.e., the monitor was functioning properly and the concentrations of the pollutant are considered accurate), however, the conditions were unusual. PM Data Analysis Workbook: Attainment
References Key Citations Fitz-Simmons T. (1999) How to calculate the particulate NAAQS. Paper presented at the National AIRS conference, San Francisco, May. U.S. EPA (1998) Fact sheet on PM data handling available at http://ttnwww.rtpnc.epa.gov/naaqsfin/fs122398.htm U.S. EPA (1999) Guideline on data handling conventions for the PM NAAQS. Prepared by the office of air quality planning and standards, Research Triangle Park, North Carolina. EPA-454/R-99-xxx. April Other References AMDAS is available at http://capita.wustl.edu/databases/userdomains/pmfine/ under “Subject Areas - Resources - Tools” PM Data Analysis Workbook: Attainment