Download
1 / 26
270 likes | 609 Views
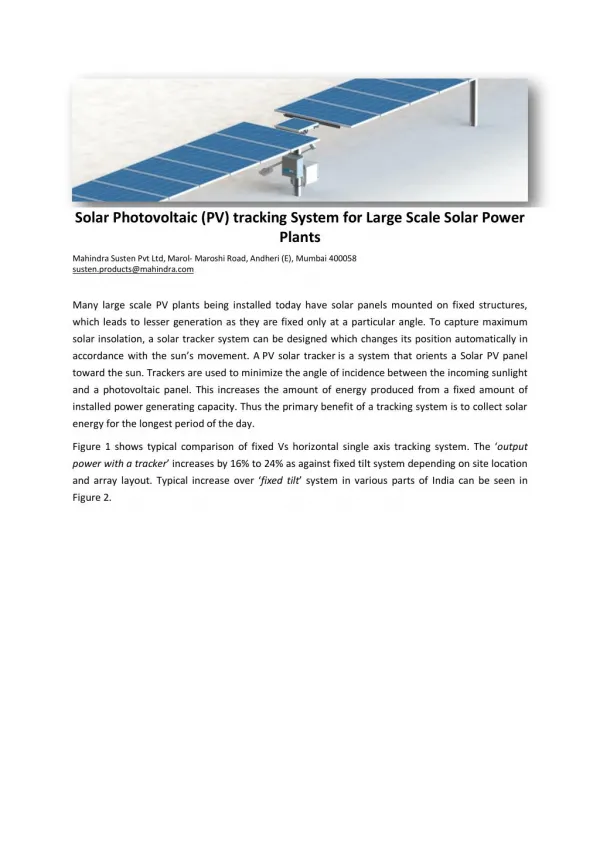
Analysis of the Maximum Power Point Tracking Simulink Model in a Three-Phase Grid-Connected Photovoltaic System. Yudie Soeryadharma Jeen Ming, Ling. ABSTRACT.

E N D
Analysis of the Maximum Power Point Tracking Simulink Model in a Three-Phase Grid-Connected Photovoltaic System YudieSoeryadharma Jeen Ming, Ling
ABSTRACT • Photovoltaic (PV) is one of the clean and free-pollution renewable energy, but it is an unreliable source because of the intermittent feature of weather. • Well integration of the MPPT technique with PV array model will ensure the system operates at its maximum power point at different weather conditions and solar irradiation. • This paper use the MATLAB Simulink to simulate the model.
INTRODUCTION • Recently, the needs of renewable energy resources increase due to the fuel energy crisis and the global warming issue. Solar energy is one of the most important renewable energy • Solar energy using photovoltaic (PV) has several advantages, e.g., no noise and free pollution. • Twooperational problems, the efficiency is very low especially under low irradiation conditions and in the intermittent weather condition the electric power changes continuously.
What is MPPT and why it is needed? (Maximum power point tracking) It is needed a controller (MPPT) to achieve the highest efficiency and provide a stable power under the intermittent weather condition • Why IC technique ? It shows good performance under the intermittent of solar irradiance The simulation result will show how good is the performance of this IC technique.
PV Model • A solar cell basically is a p-n semiconductor junction. When exposed to light, a dc current is generated.
IC MPPT Technique • The incremental conductance method is developed under the fact of slope of the PV array power curve is zero at the MPP IC MPPT Algorithm
Simulation under constant solar irradiance • The maximum standard operating for constant solar irradiance is assumed to be 1000 W/m2 in the study. (A) The measured output of PV Module (B) The respond of IC MPPT tracking algorithm
Output from boost converter Under 1000 W/m2 of solar irradiance, The duty cycle for boost converter is a constant value 0.45 and the booster convert around 92kW of power with constant ouput voltage 500 V to the PV inverter.
Comparison of the measured output of PV module with output of boost converter • The PV module provides 100kW and the boost converter convert 92kW of energy
Simulation under decreasing solar irradiance The figure shows the decreasing solar irradiance (1000 W/m2- 800 W/m2 -250 W/m2). (A) Decreasing of solar irradiance(B) Duty cycle of boost converter
(A) The measured output of PV Module (B) The respond of IC MPPT tracking algorithm
Output from boost converter • The figure shows the power, voltage, current of boost converter. Under (1000 W/m2- 800 W/m2 -250 W/m2) of solar irradiance, the booster convert around 92kW - 80 kW - 25 kW of power. The booster maintains the output of voltage to be 500 V to the PV inverter.
Comparison of the measured output of PV module with output of boost converter • The PV module provides 100kW (1000 W/m2) 80kW (800W/m2)25kW (250 W/m2)and the boost converter convert 92kW, 74kW, 20 kW
Simulation under different solar irradiance The figure A shows the variations of solar irradiance (600 W/m2- 800 W/m2 - 400 W/m2 -600 W/m2) Figure B shows the duty cycle of boost converter responding to different solar irradiance. In fact, an extreme variation of solar irradiance occur rarely.
(A) The measured output of PV Module (B) The respond of IC MPPT tracking algorithm
Output from boost converter The figureshows the measurement output from boost converter. The figure shows the power, voltage, current of boost converter. Under (600 W/m2- 800 W/m2 - 400 W/m2 -600 W/m2) of solar irradiance, the booster maintains output voltage to be 500 V constantly.
Comparison of the measured output of PV module with output of boost converter The power efficiency is approximately 90%. The simulation result shows the MPPT works and respond fast and well even in any behavior of solar irradiance and also gain a high efficiency
PV module connected to grid • The simulation is under 1000 W/m2 of solar irradiance. • Output voltage of PV Inverter • Output voltage of load
The figure shows the voltage after connected to the grid. to phase A-B in 25 kV voltage level. • Output voltage of grid
Conclusion • In this paper, different solar radiations is used to investigate the performance of IC MPPT. • Simulation results show the IC MPPT technique in the PV system achieves the tracking of maximum power point with acceptable system performance and fast response. • For the future, the IC technique will be a reliable MPPT to apply in the real power system because of the intermittent of solar irradiance
References • Kun, D., Bian, X.G., Liu, H.H.,and Tao, P.,“A MATLAB-Simulink-Based PV Module Model and Its Application Under Conditions of Nonuniform Irradiance,” IEEE Trans. Energy Convers., vol. 27, no. 4, Dec. 2012. • M.H. Rashid, Power Electronic Handbook. California: Academic Press, 2001. • T. Esram and P. L. Chapman, ―Comparison of photovoltaic array maximum power point tracking techniques,” IEEE Trans. Energy Convers.,vol. 22, no. 2, pp. 439–449, Jun. 2007. • J. H. Lee, H. S. Bae, and B. H. Cho, "Advanced Incremental Conductance MPPT Algorithm with a Variable Step Size," 2006 • HairulNissahZainudin, SaadMekhilef, “Comparison Study of Maximum Power Point Tracker Techniques for PV Systems”, Cairo University, Egypt, December 19-21, 2010, Paper ID 278. • M. E. Ropp and S. Gonzalez, “Development of a MATLAB/Simulink model of a single-phase grid-connected photovoltaic system,” IEEE Trans. Energy Convers., vol. 24, no. 1, pp. 195–202, Mar. 2009. • B. Verhoevenet al.. (1998) Utility Aspects of Grid Connected Photovoltaic Power Systems. International Energy Agency Photovoltaic Power Systems, IEA PVPS T5-01: 1998. [Online]. Available: www.iea-pvps.org • Matlab and Simulink, The Mathworks, Inc. http://www.mathworks.com. • SimPowerSystems for Use with Simulink, User’s Guide, The MathWorks Inc., • Y.-T. Hsiao and C.-H. Chen, "Maximum power tracking for photovoltaic power system," in Conf. Record of the 37th IAS AnnualMeeting Ind. Applicat. Conf., 2002, pp. 1035-1040. • K. H. Hussein and I. Mota, "Maximum photovoltaic power tracking: an algorithm for rapidly changing atmospheric conditions," in IEE Proc. Generation, Transmission, and Distribution, 1995, pp. 59-64.. • S.Mekhilef, "Performance of grid connected inverter with maximumpower point tracker and power factor control,"InternationalJournal of Power Electronics, vol. 1, pp. 49-62, 2008. • N. D. Kaushika and N. K. Gautam, “Energy yield simulations of interconnected solar PV arrays,” IEEE Trans. Energy Convers., vol. 18, no. 1, pp. 127–134, Mar. 2003. • Y. Jiang, J. A. A. Qahouq, and I. Batarseh, “Improved solar PV cell MATLAB simulation model and comparison,” in Proc. IEEE Int. Symp.Circuits Syst., May/Jun. 2010, pp. 2770–2773. • M. A. Bhaskar, B. Vidya, R. Madhumitha, S. Priyadharcini, K. Jayanthi,band G. R. Malarkodi, “A simple PV array modeling using MATLAB,” in Proc. Int. Conf. Emerging Trends Electr. Computer Technol., 2011,pp. 122–126.