Download
1 / 20
410 likes | 1.17k Views
Electrocardiogram ECG . Practical. COMPONENTS USED IN THE RECORDING AND PROCESSING OF AN ELECTROCARDIOGRAM.

E N D
Electrocardiogram ECG Practical
COMPONENTS USED IN THE RECORDING AND PROCESSING OF AN ELECTROCARDIOGRAM A modern electrocardiograph includes the following parts: (1) the sensitive elements, electrodes, which are attached to the body of the patient to pick up the potential differences that arise during excitation of the heart muscle, and lead wires; (2) amplifiers, which amplify the minutest voltage of e.m.f. (1-2 mV) to the level that can be recorded; (3) a galvanometer to measure the voltage; (4) a recording instrument, including a traction mechanism and a time marker; and (5) a power unit (the instrument is supplied either from the AC mains or a battery).
ANATOMICAL RELATIONS OF LEADS IN A STANDARD 12 LEAD ELECTROCARDIOGRAM Lead I: lateral wall of left ventricle Lead II: a sum potential of heart on longitudinal axis Lead III: right ventricle and posterodiaphragmatic (inferior) surface of left ventricle aVR: a sum potential of heart on longitudinal axis (the heart vector is oriented from this electrode, therefore Р wave, maximal wave of QRS complex and Т wave are negative); aVL: high areas of lateral wall of left ventricle aVF: right ventricle and posterodiaphragmatic (inferior) surface of left ventricle V1 and V2: anterior wall of heart V3: anterior area of the interventricular septum V4: heart apex V5: anterolateral wall of left ventricle V6: lateral surface of left ventricle.
MAKING A RECORDING • The patient must lie down and relax (to prevent muscle tremor) • Connect up the limb electrodes, making certain that they are applied to the correct limb • Calibrate the record with the 1 mV signal • Record the six standard leads – three or four complexes are sufficient for each • Record the six V leads.
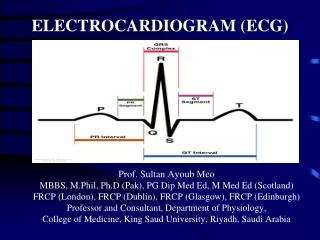
THE NORMAL ELECTROCARDIOGRAM The P wave is generated by activation of the atria.The PR segment represents the duration of atrioventricular (AV) conduction.The QRS complex is produced by depolarization of both ventricles.The ST-T wave reflects ventricular repolarization.
CHARACTERISTICS OF THE P WAVE • Positive in leads I and II • Best seen in leads II and V1 • Commonly biphasic in lead V1 • < 0.1 sec in duration • < 2.5 mm in amplitude
MORPHOLOGY OF THEQRS COMPLEX IN THE PRECORDIAL LEADS In the precordial leads, QRS morphology changes depending on whether the depolarization forces are moving towards or awayfrom a lead. The QRS complexgradually changes from being predominantly negative in lead V1to being predominantly positive in lead V6.
CHARACTERISTICS OF THE ST SEGMENT The QRS complex terminates at the J point or ST junction. The ST segment lies between the J point and the beginning of theT wave, and represents the period between the end of ventriculardepolarisation and the beginning of repolarisation. The ST segment should be in the same horizontal plane as the TP segment; the J point is the point of inflection between the S wave and ST segment.
CHANGE IN ST SEGMENT MORPHOLOGY ACROSS THE PRECORDIAL LEADS In leads V1 to V3 the rapidly ascending S wave merges directly with the T wave, making the J point indistinct and the ST segmentdifficult to identify. This produces elevation of the ST segment,and this is known as "high take-off." Non-pathological elevation of the ST segment is also associated with benign early repolarization, which is particularly commonin young men, athletes, and black people.
QT INTERVAL The QT interval is measured from the beginning of the QRS complex to the end of the T wave and represents the total time takenfor depolarization and repolarizationof the ventricles. The normal QT interval should be 0.35-0.45 sec, andshould not be more than half of the interval between adjacentR waves (R-R interval).
THE ORDER ECG INTERPRETATION • Regularity of heart beats (regular, irregular) • Rhythm (sinus or other) • Heart rate • Cardiac axis • A description of the P wave • Conduction intervals • A description of the QRS complexes • A description of the ST segments and T waves • A description of the QT interval • ECG report.
THE ECG REPORT • Rhythm (sinus or other) • Regularity of cardiac rhythm (regular, irregular) • Heart rate • Cardiac axis • ECG abnormalities of:- rhythm- conduction- hypertrophy of myocardium of ventricles or atria- myocardial damage (ischemia, injury, necrosis, scar)
THEELCTRICAL AXIS OF THE HEART The axis of the ECG is the major direction of the overall electrical activity of the heart. The QRS axis is the most important to determine. The T wave and P wave axis can also be measured.
LEAD VECTORS The three bipolar limb leads, the three augmented unipolar limb leads (left), and the six unipolarprecordial leads (right).
HEXAXIAL DIAGRAM Projection of six leads in vertical plane showing each lead's view of the heart. The Bayleyhexaxial reference system composed of the lead axes of the six frontal plane leads. The lead axes of the six frontal plane leads have been rearranged so that their centers overlay one another. These axes divide the plane into 12 segments, each subtending 30 degrees. Positive ends of each axis are labelled with the name of the lead.
THE ELECTRICAL AXIS Calculation of the mean electrical axis during the QRS complex from the areas under the QRS complex in leads I and III. Magnitudes of the areas of the two leads are plotted as vectors on the appropriate lead axes, and the mean QRS axis is the sum of these two vectors.
Mean Electrical Axis • The normal QRS axis lies between -30o and +110o. • A QRS axis that falls between -30o and -90o is abnormal and called left axis deviation (LAD). • A QRS axis that falls between +110o and +180o is abnormal and called right axis deviation (RAD). • A QRS axis that falls between +180o and -90o is abnormal and called indeterminate (northwest NW). • left
Left MVA Deviation Right MVA Deviation