Download
1 / 30
350 likes | 880 Views
Electrocardiogram ECG I. BASIC PRINICPLES Dr. Amel Eassawi. OBJECTIVES. The s tudent s hould be able to: Describe the relationship between the action potential, cardiac contraction and electrocardiogram. Define the electrocardiogram leads and their positioning.

E N D
Electrocardiogram ECG I BASIC PRINICPLES Dr. AmelEassawi
OBJECTIVES • The student should be able to: • Describe the relationship between the action potential, cardiac contraction and electrocardiogram. • Define the electrocardiogram leads and their positioning. • Describe, label and explain the waves, complexes, segments and intervals in normal electrocardiogram. • Determine heart rate from the electrocardiogram. • Discuss the vectorial analysis of the electrocardiogram. • Calculate the mean electrical axis. • Identify the different types of abnormalities associated with electrocardiogram.
Electrocardiogram: Measures the electrical activity of the heart per unit time. Potential differences generated by the heart are conducted to body surface where they can be recorded by placing electrodes on the skin. ECG measures the electrical gradient with respect to the positive electrodes. The electrical wave moves from negative electrodes to positive electrodes. ECG does not record a potential at all when the ventricular muscles is either completely depolarized or completely repolarized. Even though the same electrical events are occurring in the heart, different wave forms representing the same electrical activity is recorded by electrodes at different points of the body. ECG does notmeasurethe flow of blood through the heart. Electrocardiogram
Electrocardiogram Electrocardiogram (ECG) is used to measure: Heart rate. Regularity of heart beats. Size and positions of chambers. Damage of the heart muscle. Effect of drug or devices (pacemaker).
Electrocardiograph: Thedevice used to records ECG. Lead:Has two meaning: The cable used to connect am electrode to the ECG device. The electrical view of the heart obtained from any combination of electrodes. Each lead look at the heart from different angle. Electrode:Metallic plate which conducts electricity. Isoelectric line: The base line equivalent to (0mV) and represents the periods in the cardiac cycle when there is no currents. Upward deflection: Wave of depolarization travelling towards a positive electrode result in upward deflection. Downward deflection: Wave of depolarization travelling away from a positive electrode result in downward deflection. Electrocardiogram
Standard 12 Lead Electrocardiogram The 12 different leads each record electrical activity in the heart from different locations. Six Limb Leads : Frontal plane currents (right, left, inferior, superior) • Three Bipolar Limb Leads( standard limb leads) named as , I, II , III • Three Unipolar Limb Leads ( augmented limb leads) named as aVR, aVL, aVF Six Precordial (Chest) Leads: Horizontal plane (anterior, posterior, right and left forces) (V1- V6) Electrocardiogram
The basic four limb electrodes: Right arm Left arm electrical polarity: neutral or ground negative positive (manipulated by the ECG machine) Right leg Left leg
Lead I (towards left) Left arm Right arm electrical polarity: neutral or ground negative positive Right leg Left leg
Lead II (toward left foot) Right arm Left arm electrical polarity: neutral or ground negative positive Right leg Left leg
Lead III (down & rightward) Right arm Left arm electrical polarity: neutral or ground negative positive Right leg Left leg
Leads I, II, & III together(“Einthoven’s triangle”) Right arm Left arm electrical polarity: neutral or ground negative positive Right leg Left leg
Bipolar Limb Leads The axis of the limb leads form an equilateral triangle around the heart’s electrical field
Plus “augmented” leadsaVR aVL aVF Right arm Left arm electrical polarity: neutral or ground negative positive Right leg Left leg
Unipolar Leads 3 augmented leads aVR, aVL and aVF and 6 chest leads V1-V6 Leads
Bipolar Standard Limb Leads: Record the electrical potential difference in the frontal plane In bipolar lead, we record potential difference between two active electrodes. 3 leads I II and III Unipolar (Augmented) Leads Record electrical potential in the frontal plane In unipolar lead, we record potential difference between active electrode and other electrode at zero potential. leads 3 augmented leads aVR, aVL and aVF. Electrocardiogram
Calibration of ECG Vertical axis is the voltage recording 10 mm= 1 mV Horizontal axis is the time recording 1mm= 40 msec
Electrocardiogram waveforms in lead II and electrical status of heart associated with waveform
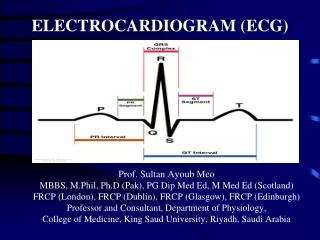
Basic Components P wave: Atrial depolarization. QRS complex: Ventricular depolarization. T wave: Ventricular repolarization. QRS duration : 0.08 – 0.10 sec
Segments and Intervals • Segments are isoelectric portions without waves • PR: all ventricle mass is at rest (AV nodal delay). • ST: all ventricle is depolarized (Time during which ventricles are contracting and emptying) • TP: all ventricle is repolarized (time during which ventricles are relaxing and filling) • Intervals designate waves and segments in between. • PR interval:Atrial depolarization + delay in AV junction (AV nodal delay allows time for the atria to contract before the ventricles contract). PR interval: 0.12 - 0.20 sec • QT interval: electrical systole. 0.40 - 0.43 sec • ST interval :0.32 - sec • PP and RR intervals can be used to measure heart rate
Human physiology, Lauralee Sherwood, seventh edition. • Text book physiology by Guyton &Hall,11th edition. • Physiology by Berne and Levy, sixth edition. References