Download
1 / 71
740 likes | 1.53k Views
Electrocardiogram ECG Part 1 Made for understanding. By Mandy Gutliph Stephanie Feldman. Electrocardiography or ECG is a important diagnostic tool for Veterinary Medicine. ECG’s measure the electrical activity of the heart.

E N D
ElectrocardiogramECGPart 1Made for understanding By Mandy Gutliph Stephanie Feldman
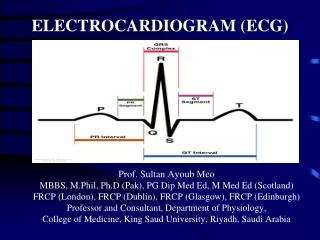
Electrocardiography or ECG is a important diagnostic tool for Veterinary Medicine. ECG’s measure the electrical activity of the heart. These measurements are called Lead Polarity and are represented by P,Q,R,S, and T (as shown below) The P wave represents Atrial Depolarization The QRS wave represents Ventricular DepolarizationThe T wave represents Ventricular Repolarization
Patient Set-up Your patient, any mammal, should be sedated or anesthetized for this procedure THE ANIMAL MUST ALWAYS BE IN RIGHT LATERAL RECUMBENCY! Use a rubber mat between metal tables and patient to prevent any electrical interference!
Cables The Basics Black cable- Attaches to Left Front Leg!White cable- Attaches to Right Front Leg!Red cable- Attaches to Left Rear Leg!Green cable- Attaches to Right Rear Leg! *Remember Snow (white) and Grass (green) are always on the ground (right side) * Remember you always read the newspaper (black and white) at the beginning of the day (front legs)
Negative and Positive Poles You can change the Lead (I,II,III) to measure different parts of electrical activity (heart) to better diagnosis the patient. Lead I- Causes the cables at the Right forelimb – Negative Pole Causes the cables on the Left forelimb – Positive Pole Lead II – Causes the cable on the Right forelimb – Negative Pole Causes the cable on the Left hind limb – Positive Pole Lead III- Causes the cable on the Left hind limb – Positive Pole Causes the cable on the Left forelimb – Negative Pole
A Recap Of Heart Anatomy • SA or Sinoatrial node • AV or atrioventricular node • Bundle of His • Purkinje fibers
What does those lines mean? The P wave or atrial depolarization is a small bump because the walls of the atria are thinner than the walls of the ventricle, therefore, the total amount of electrical activity is smaller than the ventricle, or QRS wave. The individual squares measure time and amplitude.
What Does it Diagnose? • Cardiac Arrhythmias • Heart Rate • Axis Deviations • Chamber enlargement • Conduction abnormalities This is a irregular rhythm
questions • Which of the following types of information can be gathered from an ECG? A. Heart rate B. Axis deviation C. conduction abnormalities D. All of the above 2) Which one of these important heart structures is not measured in an ECG? A. AV Node B. SA Node C. Purkinje Fibers D. Posterior vena cava 3) The P wave represents Depolarization of: A. Atria B. Ventricle C. Aorta D. vena cava 4) The QRS wave measures Depolarization of: A. Atria B. Ventricle C. Aorta D. Vena cava 5) The T wave measures A. Depolarization of the atria B. Depolarization of the ventricle C. Repolarization of ventricle 6) Lead II is: A. + on Right Forelimb, - on Left forelimb B. – on right forelimb, + on left forelimb C. – on right forelimb, + on left hind limb
Answers 1 D 2 D 3 A 4 B 5 C 6 C
Basic ElectrocardiographyPart 2 By Mandy Gutliph And Stephanie Feldman
Producing a Diagnostic ElectrocardiogramPosition and Lead Placement • Animal should be in right lateral recumbency • Their front legs should be perpendicular to their spine. • Animal should be comfortable • Animals that have trouble breathing can be done standing up or in ventral recumbency
Alligator Clips • Flattened alligator clips are placed below the elbow on the forelimbs and below the stifle on the hind limbs. • Remember to make sure the clip is on the skin, not just on the hair. • You can use alcohol or electrode paste as a contact solution. • Alcohol usually works well, but needs to be put onto the skin at regular intervals because it evaporates • Electrode paste should be used if the readings are not working well with just the alcohol.
Checking ECG Machine 1. The sensitivity setting- a setting of 1 makes a 1cm deflection of the pen, when the millivolt button is pushed. The standard sensitivity is 1milivolt. Remember that 1 millivolt = 1cm. So you can change the sensitivity with the sensitivity selector to either 0.5cm or 2cm. When you do this, then 1 millivolt = .5cm or 2cm. This should be done if your waves are too small or too large to interpret.
Paper Speed • Most ECGs are run at 50mm/sec. • To change this, use the speed selection knob. • There are normally just two choices, 50mm/sec and 25mm/sec.
Lead Selections • The different lead selections are marked at the top of the paper. • Normally, 1 dot means lead 1 • 2 dots mean lead 2 • 3 dots mean lead 3 • Just remember that there are a whole bunch more lead selections, that we do not have to know.
Artifacts Artifacts • Artifacts are common, and must be recognized to be corrected. • There are 3 common types • Sixty-cycle interference • Muscle tremors • Wandering Baseline
1 Sixty Cycle Interference • This is an electrical interference pattern that occurs when the electrical equipment is not properly grounded • Looks like continuous electrical stimulations on readout. • To fix, try one of the following • Make sure power cord is grounded, clips are contacting skin, clips are clean and securely attached to cable, pull plugs on nearby equipment, turn off fluorescent lights, make sure cables are not touching one another, and that no one else is touching cables.
2 Muscle Tremors • This looks like rapid and random movements of the baseline. • To fix, calm animal. • Sometimes placing a hand on them will help them to relax. Also, cats that are purring can cause this.
3 Wandering Baseline • This is commonly caused by the animals chest movement when they breath. • To fix, allow them to stand, or go into ventral recumbency, or hold mouth closed for 3-5seconds to get a quick reading. • It looks on the readout like the baseline is looping down.
Interpreting The Electrocardiogram • This is pretty complicated, and takes a lot of training and practice. • Technicians should how to calculate a heart rate by looking at an ECG.
Heart Rate • Hear Rate is regulated by a balance of sympathetic and parasympathetic inputs. • REVIEW- • Sympathetic nervous stimulation does what to the heart rate? • Parasympathetic nervous stimulation is done through which nerve, and does what to the heart rate?
Answers • Sympathetic nervous stimulation increases the heart rate • Parasympathetic nervous stimulation occurs through the vagal nerve and lowers the heart rate.
More about Heart Rate • Remember the sinoatrial node is the biological pacemaker of the heart, and under normal conditions the heart beats between 80 and 120 times per minute. • The next node is the atrioventricular.
Calculating Heart Rate 1. Count the R waves registering within 6 seconds and multiply by 10. (quick yet inaccurate method) 2. Count the number of large squares between two R waves and divide by 300. (this loosed accuracy when used to calculate fast heart rates and can only be used with regular rhythms) 3. Count the number of small squares between two R waves and divide by 1500. (most accurate method but can only be used with normal rhythms.)
Interval and Amplitude Measurements • These are usually done with lead II. • At 50mm/sec each small box horizontally measures 0.02seconds. • Measurements of P-R interval and ST segment etc. are things we do not need to understand
Determining What is Normal • There are Three normal rhythms that we see. • Sinus rhythm • Respiratory sinus rhythm • Wandering Pacemaker
Sinus Rhythm • Sinus rhythm occurs when the heart rate falls between 60 and 140 beats/min in dogs and 120 -200 beats/min in cats. • There is a P wave every QRS complex, the rhythm is regular and the intervals have normal values.
Respiratory Sinus Arrhythmia • This is the same heart function of a sinus rhythm, except that the heart rate is variable because it corresponds with respiration. • As patient inhales, the heart rate increases • As patients exhales, the heart rate decreases.
Wandering Pacemaker • This is when the P waves have varied conformations and sizes within the same lead. • The pacemaker site may shit locations within the sinoatrial node, causing the vectors to shift slightly. This can be seen commonly with respiratory sinus rhythm.
SUMMARY • So remember • Proper position is crucial • And that patient comfort is part of this! • Artifacts occur on the ECG • Three common ones are 60-cycle interference, muscle tremors, wandering baseline • Heart rate is a function of several variables and is regulated by a balance of sympathetic and parasympathetic outputs. • Evaluation of intervals also plays a role, and you should know three normal rhythms • They are the sinus rhythm, the respiratory sinus arrhythmia, and the wandering baseline!
Basic ElectrocardiogramPart 3 By Mandy Gutliph Stephanie Feldman
There are 4 steps to interpreting ECG: • The first step is to evaluate the P wave. • The P wave indicated whether the atrial rhythm is normal. • Questions to ask yourself about P waves: • Are all the P waves occurring at regular intervals? • Do all the P waves have the same appearance on the ECG? • Are the P waves visible at all? • If any of these questions, you answered “no”; further investigation is needed. • P waves occur at regular intervals during normal sinus rhythm.
The second step is to determine whether the ventricles are activated from inside the ventricles; or from another location. • This can be done by looking at the duration (time) of the QRS complex. A QRS complex of normal duration is 0.04-0.06 seconds. This indicates that waves are going along normal pathways (conduction tissues) A QRS complex longer than 0.6 seconds has left normal pathways and occurs within Ventricular Myocardium. When it takes longer this is called: Ventricular Complex; and causes the QRS complex to have a wide and bizarre appearance on the ECG Ventricular Myocardium: muscular structure of the ventricle.
The third step is to determine the relationship between the P wave and the QRS complex. • This determines whether the atria and ventricles are working in sync! • You must determine whether the P wave is always, never or sometimes associated with the QRS complex. • Does the P wave always come before the QRS complex? Where's the P wave?
Finally, look for anything abnormal. • Arrhythmias • Escaped beats • And anything else that doesn’t produce the classic PQRST complex. Arrhythmia BAD! Asystole! No heartbeat!
Premature Beats • Atrial premature contraction is a beat that is not synchronized with the rest of the rhythm. The P-R interval may be short, normal or long depending on the origin of the premature beat. Sites of origin are SA node or ectopic (displaced) locations in the atria. It may or may no affect the QRS complex (ventricular contraction)
Ventricular Premature Contraction • Ventricular premature contractions are characterized by wide, bizarre QRS complex’s without including the P wave. This happens when repolarization and depolarization occurring on a cell – to – cell basis within the myocardium. This looks very different from other QRS complex’s of sinus origin. This can be determined by looking at lead II. The QRS complex can either deflect downwards or upwards in Ventricular Premature Contraction. Sinus: normal
Escaped Beats • The depolarization of other areas of the cardiac anatomy resulting FROM a failure of the SA (Sinoatrial node) to depolarize is called an escaped beat. • Usually if the SA node fails to depolarize the AV node, or atrioventricular node, depolarizes to compensate for the pause in blood flow. • When the AV node depolarizes, the current travels both upwards to the atria and through the ventricles. When it goes through the ventricles the QRS complex is normal BUT atrial depolarization, or P wave, is spiked downward. • *The difference between Ventricular premature contraction and Ventricular escaped beats is extremely important. The VPC is an occurrence within the ventricle that interrupts a normal sinus beat WHILE an escaped beat is a failsafe mechanism that interrupts a life-threatening arrest. Note how the backwards P wave is after the QRS complex
Supraventricular Arrhythmias • Supraventricular arrhythmia are arrhythmias that occur above the ventricles. Such arrhythmias include sinus bradycardia, sinus tachycardia, atrial flutter, atrial fibrillation, junctional rhythm and bundle branch blocks. Sinus Bradycardia Atrial Flutter
Sinus Bradycardia • Sinus bradycardia is a normal sinus rhythm that occurs when the heart beats less than 60 beats/minute in dogs and less than 70-80 beats/minute in cats. • Sinus bradycardia might be normal for some animals and must be evaluated case by case.
Sinus Tachycardia • Sinus tachycardia is a normal sinus rhythm that is faster than 160 beats/minute in dogs and faster than 240 beats/minutes in cats.
Atrial Flutter • It is the rapid depolarization of the atria. • Looks on ECG like saw tooth waves between QRS complexes. • What happens in the heart basically goes like this: • The AV node is flooded with depolarizations from the atria, and thus the AV node may not be able to repolarize. • So, it cannot accept the impluses from the atria. • Once it finally repolarizes, the AV node can then take the impulse, and it passes to the ventricles. • Thus the rate of the atria is different than the rate of the ventricles.
Atrial Fibrillation • This is characterized by no recognizable P waves, a regularly irregular rhythm, and a fast rate for both the atria and the ventricles. The atria therefore ‘beats’ at a rate of 350 to 600 beats/min. • Thus the atria fails to fill with blood and then the total output of the heart is decreased. • Ventricular rate is also irregular because the AV node receives countless impulses from the atria at erratic intervals.