Download
1 / 28
761 likes | 2k Views
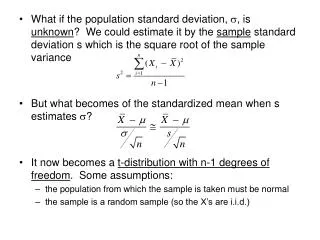
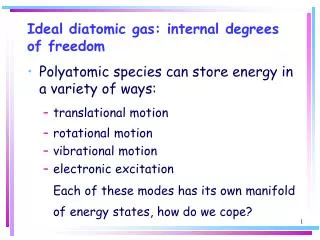
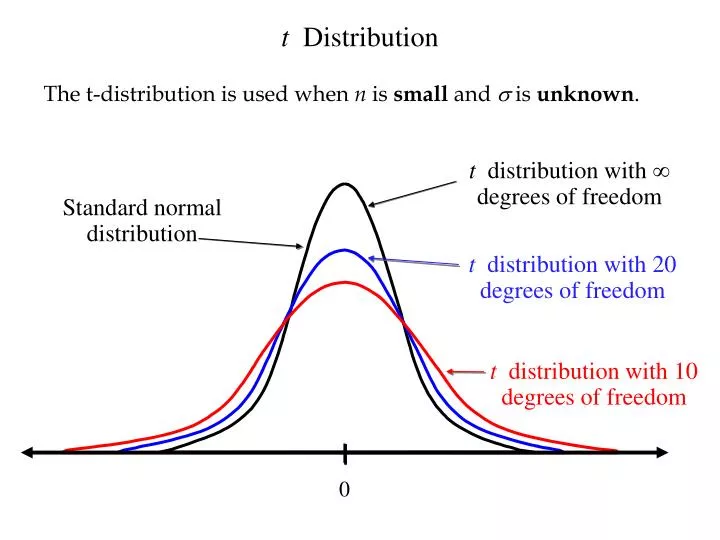
t Distribution. The t-distribution is used when n is small and s is unknown . t distribution with ∞ degrees of freedom. Standard normal distribution. t distribution with 20 degrees of freedom. t distribution with 10 degrees of freedom. 0. t Distribution.

E N D
t Distribution • The t-distribution is used when n is small ands is unknown. tdistribution with ∞ degrees of freedom Standard normal distribution tdistribution with 20 degrees of freedom tdistribution with 10 degrees of freedom 0
t Distribution • If n is large there is no difference between the standard normal and t distributions. tdistribution with ∞ degrees of freedom Standard normal distribution • .0250 t.0250= ? 0
t Distribution • If n is large there is no difference between the standard normal and t distributions. • P(> 1.96) = .0250 • t
t Distribution • If n is large there is no difference between the standard normal and t distributions. • P(> 1.96) = .0250 • t tdistribution with ∞ degrees of freedom Standard normal distribution • .0250 1.96 0
t Distribution • If n is large there is no difference between the standard normal and t distributions. • z • P(> 1.96) = .0250 • t
t Distribution • If n is large there is no difference between the standard normal and t distributions.
t Distribution • If n is large there is no difference between the standard normal and t distributions. tdistribution with ∞ degrees of freedom Standard normal distribution • .0250 1.96 0
t Distribution • If n is large there is no difference between the standard normal and t distributions. with df = 20 • .0250 t.0250= ? 0
t Distribution • If n is large there is no difference between the standard normal and t distributions. with df = 20 • P(> 2.086) = .0250 • t
t Distribution • If n is large there is no difference between the standard normal and t distributions. with df = 20 • .0250 2.086 0
t Distribution • If n is large there is no difference between the standard normal and t distributions. with df = 10 • .0250 t.0250= ? 0
t Distribution • If n is large there is no difference between the standard normal and t distributions. with df = 10
t Distribution • If n is large there is no difference between the standard normal and t distributions. with df = 10 • .0250 2.228 0
Interval Estimate of a Population Mean The 1 - confidence interval for unknown m z/2 is the z value providing an area of /2 in the upper tail of the standard normal distribution s is the known population standard deviation n>2 if the data is normally distributed n>30 if the data is roughly symmetric n>50 if the data is heavily skewed and OR OR
Interval Estimate of a Population Proportion The 1 - confidence interval for unknown p z/2 is the z value providing an area of /2 in the upper tail of the standard normal distribution n>5/p n>5/(1 – p) and and
Interval Estimate of a Population Mean The 1 - confidence interval for unknown m t/2 is the tvalue providing an area of /2 in the upper tail of the t-distribution sestimates s because it is unknown n>2 if the data is normally distributed n>15 if the data is roughly symmetric n>30 if the data is slightly skewed n>50 if the data is heavily skewed and OR OR OR
x Interval Estimate of a Population Mean Example: Discount Sounds Discount Sounds has 260 retail outlets throughout the United States. The firm is evaluating a potential location for a new outlet, based in part, on the mean annual income of the individuals in the marketing area of the new location. n A sample of size of 36 was taken; the sample mean income is $31,100. The population is not believed to be highly skewed. The population standard deviation is estimated to be $4,500, and the confidence coefficient to be used in the interval estimate is .95. s 1 - a
Interval Estimate of a Population Mean Example: Discount Sounds The margin of error is: Thus, at 95% confidence, the margin of error is $1,470. Interval estimate of is: $31,100 + $1,470 $29,630 to $32,570 We are 95% confident that the interval contains m.
Interval Estimate of a Population Proportion Example: Political Science, Inc. • Political Science, Inc. (PSI) specializes in voter polls and • surveys designed to keep political office seekers informed • of their position in a race. Using telephone surveys, PSI interviewers ask registered voters who they would vote for if the election were held that day. In a current election campaign, PSI has just found that 220 registered voters, out of 500 contacted, favor McSame. PSI wants to develop a 95% confidence interval estimate for the proportion of the population of registered voters that favor McSame. n 1 - a
Interval Estimate of a Population Proportion Example: Political Science, Inc. where: n = 500, = 220/500 = .44, z.025= 1.96 = .44 + .0435 PSI is 95% confident that the proportion of all voters that favor McSame is between .3965 and .4835.
x Interval Estimate of a Population Mean Example: Apartment Rents • A reporter for a student newspaper is writing an article on the cost of off-campus housing. A sample of 16 efficiency apartments within a half-mile of campus resulted in a sample mean of $650 per month and a sample standard deviation of $55. n s 1 - a Compute a 95% confidence interval estimate of the mean rent per month for the population of efficiency apartments within a half-mile of campus. We will assume this population to be normally distributed.
Interval Estimate of a Population Mean = .05, /2 = .025. t.025 is based on df =n- 1 = 16 - 1 = 15 • At 95% confidence,
Interval Estimate of a Population Mean Interval Estimate Est. Margin of Error We are 95% confident that the mean rent per month for the population of efficiency apartments within a half-mile of campus is between $620.70 and $679.30. Point Estimate of the population mean Interval Estimate of the population mean Interval Estimate of the population mean
Sufficient Sample Size for the Interval Estimateof a Population Mean • Recall that Discount Sounds is evaluating a potential location for a new retail outlet, based in part, on the mean annual income of the individuals in the marketing area of the new location. • Suppose that Discount Sounds’ management team • wants an estimate of the population mean such that • there is a .95 probability that the margin of error is $500 • or less. How large should the sample be? 1-a n? E Recall that = 4,500. At 95% confidence, z.025 = 1.96.
Sufficient Sample Size for the Interval Estimateof a Population Proportion Example: Political Science, Inc. • Suppose that PSI would like a .99 probability that the sample proportion is within .03 of the population proportion. How large should the sample be to meet the required precision? Recall that in the previous example, a sample of 500 similar units yielded a sample proportion of .44. 1-a E p* a = .01, At 99% confidence, z.005 = 2.575 a/2 = .005,
.950 .025 .025 Repeated Sampling s = 10 n = 64 a = 0.05 z.025 = 1.96
.950 .025 .025 Repeated Sampling s = 10 n = 64 a = 0.05 z.025 = 1.96
.950 .025 .025 Repeated Sampling s = 10 n = 64 Example: Political Science, Inc. a = 0.05 z.025 = 1.96