Download
1 / 15
150 likes | 448 Views
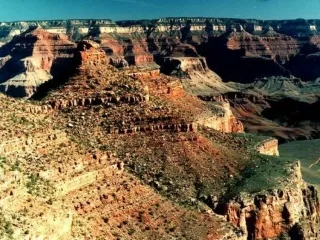
Topography. Mr. Cesaire Martin Van Buren High School. Aim: How do contour lines describe topography? Do Now: Copy down the following definitions: Topographic Profile- is a cross sectional view that shows the elevation of the land.

E N D
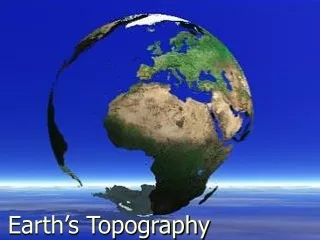
Topography Mr. Cesaire Martin Van Buren High School
Aim: How do contour lines describe topography? • Do Now: Copy down the following definitions: • Topographic Profile- is a cross sectional view that shows the elevation of the land. • Gradient- average slope; is the rate of change in field values between two points in a field. • HW- Read the instructions and contour the set of data points. • Lab Thursday room 254
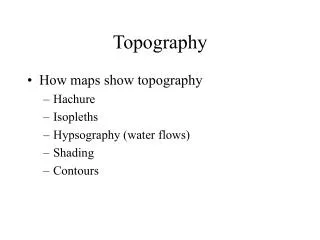
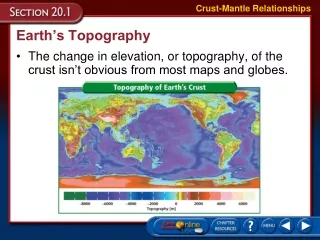
Topographic Maps • Topographic maps shows the elevation of an area. • Topographic maps tell the user how high or how steep an area of land is to sea level (0 m or ft). • The further apart contour lines, the flatter or less steep the land. • The closer the contour lines, the steeper the land. • Let’s look at several examples
Topographic Maps The top part of this illustration is a profile or side view of the bottom illustration. Notice how the contour lines on the left side of the hill is spread further apart. The slope is gentle . On the right side of the hill, the contour lines are closer together. The closer the contours, the steeper the hill. http://www.csulb.edu/~rodrigue/geog140/contours.jpg
Topographic Maps Another example of a contour map and the complimentary side or profile view. What do you notice about the contour lines and the steepness of the hill?
The image on the left is a volcano that has an increasing contour interval of 200 feet. But what happens to the contour value when it reaches the rim and beyond? On a contour map, you express a depression (hole, bowl) with line or hachured lines. The interval is the same.
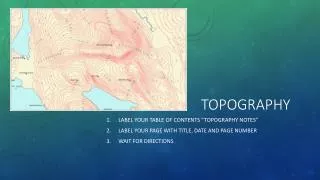
The illustration above is a USGS topographic map of the area around Martin Van Buren High School. Observe the contour lines behind the school. What can we tell from the contours behind the school that describes the topography of the land?
Describe the topography going away from Alley Pond Park. What does the contour lines tell you about the topography of Alley Pond Park?
Water Table Contour • Water Table- the depth to ground water • Where is the water table the deepest?
Gradient • A question that we need to ask is how do we calculate the change of values between two points? • The change in field values between two points is called the gradient. • The formula for gradient is expressed as: • = The difference between point A and B/The distance between A and B
Gradient=Slope • We can also think of gradient in terms of math.